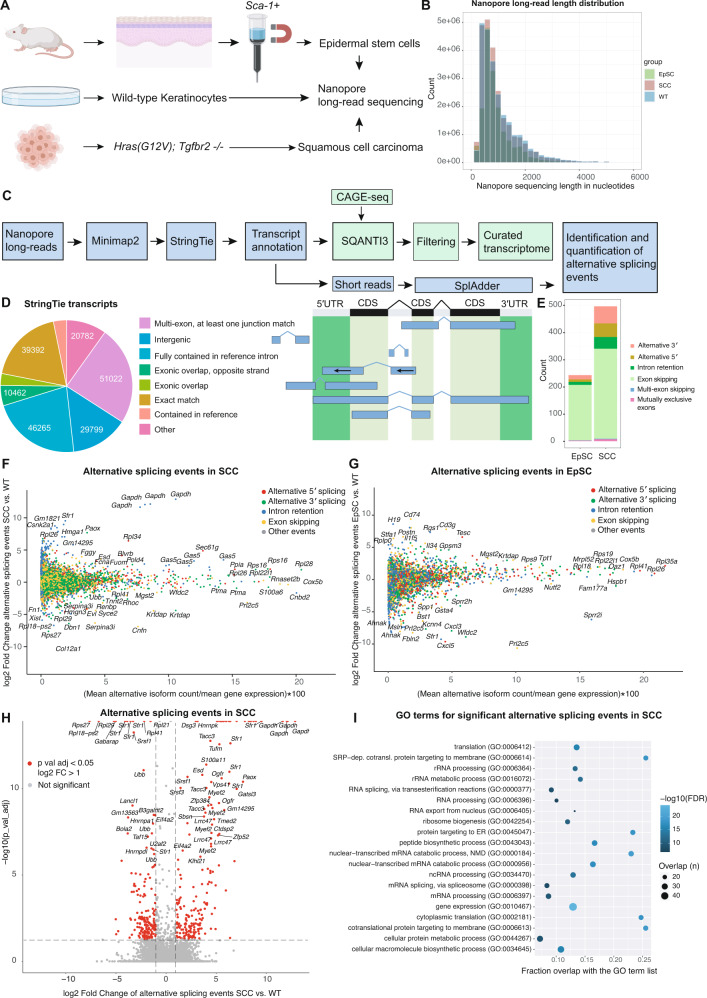
Fig. 1. Nanopore long-read sequencing identifies alternative mRNA isoforms in the mouse skin.
A Experimental outline for the isolation of SCA-1+ epidermal stem cells (EpSC), wild-type keratinocytes (WT) and cultured squamous cell carcinoma cells (SCCc) used for Nanopore long-read sequencing. B Read length distribution for the Nanopore long-read sequencing data set of epidermal stem cells (EpSC), wild-type keratinocytes (WT), and squamous cell carcinomas (SCCc). The mean read length was between 943-1035 bp (EpSC: 943 bp, WT: 1035 bp, SCCc: 994 bp). C Bioinformatic pipeline for the processing of the Nanopore long-read sequencing data to identify and quantify alternative isoforms in epidermal stem cells and squamous cell carcinoma cells. Nanopore long-reads were mapped and a StringTie transcriptome was built. Transcripts were then filtered by the SQANTI3 pipeline and a quality control report was created (M&Ms). As an additional filtering step, transcripts were confirmed by CAGE-seq transcription start sites (TSSes) to build a curated transcriptome. Based on the transcriptome annotation and the short-read RNA sequencing data, SplAdder was used for the identification and quantification of alternative splicing events. D Quantification and categorization of the total transcript numbers identified by StringTie using the Nanopore long-read sequencing data of SCA-1+ epidermal stem cells (EpSCs), wild-type keratinocytes, and squamous cell carcinomas (SCCc) before filtering by SQANTI3 and CAGE-seq. Right panel shows examples for the different categories as defined by StringTie for transcript identifications, and the left panel shows the respective numbers. E Numbers and categories of significantly changed splicing events in epidermal stem cells (EpSC) and squamous cell carcinomas (SCCc), compared to wild-type keratinocytes, as identified by the SplAdder pipeline. F, G The landscape of alternative isoforms in squamous cell carcinoma cells or epidermal stem cells compared to wild-type keratinocytes using SplAdder, which quantifies and tests alternative splicing events. Color-coded are alternative 5′ splicing, 3′ splicing, intron retention and exon skipping events. The x-axis shows the alternatively spliced isoforms as a percentage of total gene expression, the y-axis shows the fold change of the alternative event. H Volcano plot showing the significant alternative splicing events and fold changes of splicing events in squamous cell carcinoma cells (SCCc) compared to wild-type keratinocytes (WT). Red indicates a significant >2× fold change in alternative splicing events. I Gene expression (GO:0010467) is the top gene ontology (GO) term for alternatively spliced genes in squamous cell carcinomas (SCCc) and is mainly driven by ribosomal proteins and splicing factors. GO term analysis shows the top 20 GO term hits (alphabetically ordered) with their false discovery rate (FDR, blue tone) and overlap with the GO term gene list in numbers (size of circle) and the fraction (x-axis).

