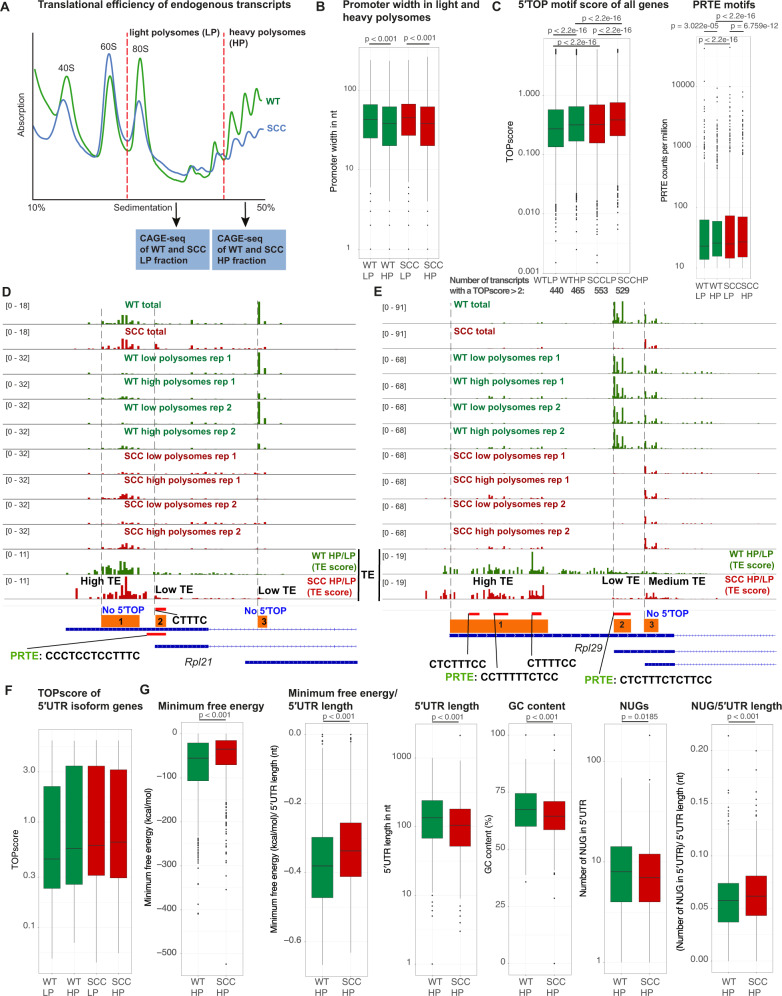
Fig. 4. Squamous cell carcinomas express 5′UTR isoforms with high translational potential.
A Outline of the combined polysome profiling and cap analysis of gene expression (CAGE-seq) strategy to map transcription start sites (TSS) in wild-type keratinocytes (WT) and cultured squamous cell carcinoma cells (SCCc). WT and SCCc lysates were subjected to sucrose density gradient fractionations and light polysome (LP) and heavy polysome (HP) fractions were collected. RNA from the LP and HP fractions was isolated and CAGE libraries were prepared. Data represent the average of 2 independent experiments. B Promoter width is decreased in heavy polysome fractions in both WT and SCCc. C SCCc transcripts have higher median TOP and PRTE scores in both the light and the heavy polysome fractions. In addition, SCCc have a higher number of transcripts with a TOP score >2 (total transcript numbers below the graph). TOP scores were calculated using WT and SCCc LP and HP CAGE-seq data and the previously reported TOP score script [10]. PRTE scores were determined by searching for PRTE motifs in WT and SCCc LP and HP CAGE-seq data, normalized by the total number of reads. Median PRTE scores were 22.9 (WT LP), 25.8 (WT HP), 24.9 (SCCc LP) and 26.9 (SCCc HP). PRTE-containing 5′UTRs were defined by a PRTE score >10. PRTE: pyrimidine-rich translational element, defined by a stretch of 9 consecutive pyrimidines and an invariant uridine at position 6 in the 5′UTR. Data represent the average of 2 independent CAGE-seq experiments. P-values indicate a Wilcoxon test comparing the TOP score distributions or PRTE scores. D, E CAGE-seq peaks of total, light and heavy polysome fractions in the main three WT and SCCc TSS windows. Data were normalized and group-autoscaled to directly compare parallel CAGE-seq experiments. The last two rows display the ratios of HP/LP in WT and SCCc as a proxy for translational efficiency of the corresponding TSS. Regions were subdivided into low (ratio < 1), middle (ratio 1–3) and high TE (ratio > 3). Red bars indicate potential 5′TOP TSS with the corresponding sequence or a PRTE. PRTE: pyrimidine-rich translational element, defined by a stretch of 9 consecutive pyrimidines and an invariant uridine at position 6 in the 5′UTR. F TOP scores of light and heavy polysome fractions for the cohort of 5′UTR isoforms. G Heavy polysome 5′UTRs in SCCc are less structured and show fewer potential upstream open reading frames. WT and SCCc HP CAGE transcription start sites (ctss) were grouped into tag cluster promoter regions and directly compared using DESeq2. For the significantly up- and downregulated SCCc clusters, corresponding 5′UTRs isoforms were subsequently extracted. Upregulated 5′UTRs in SCCc and WT were compared for the minimum free energy, length, GC content and potential 5′UTR uORF initiation sites (NUGs). P-values indicate a Wilcoxon test.

