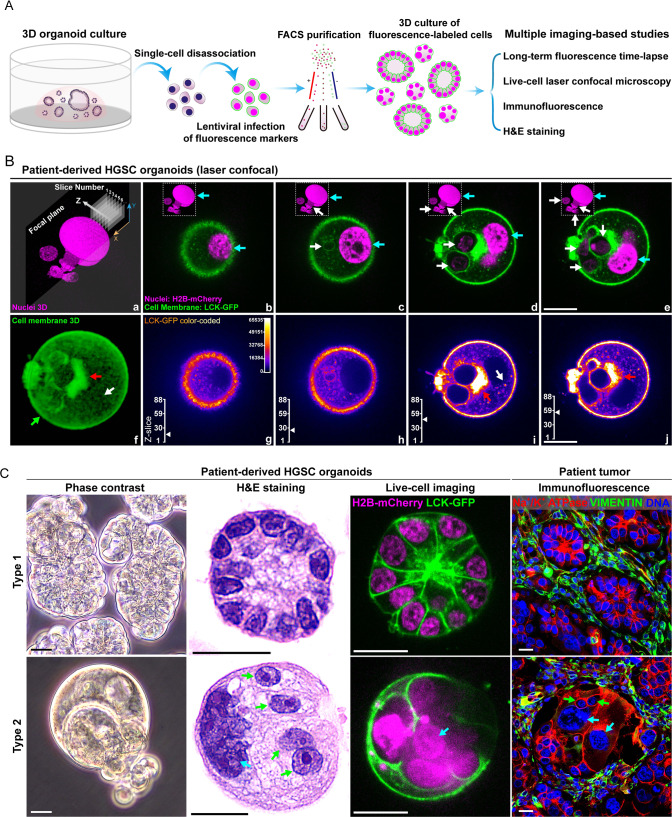
Fig. 1. Histologic characteristics of type 1 and type 2 organoids.
A The workflow for labeling patient-derived HGSC cells with fluorescence markers, cell purification, organoid culture, and imaging-based studies. FACS, fluorescence-activated cell sorting, H&E, hematoxylin-eosin. B Representative type 2 MDA-HGSC-2414 HGSC organoid with fecundity cells captured by laser confocal microscopy with Z-axis scanning. a Reconstructed 3D image of nuclei (Z-scanning). b–e Merged fluorescence images of the cell membrane (green) and nuclei (magenta) from four Z-slices. Cyan arrows: PGCC nuclei; white arrows: fecundity cells. f The reconstructed 3D image demonstrates the overall cell membrane distribution and structures. Pixels were adjusted to 70% transparency to show the vesicle-rich region in the center of the organoid. g–j Color-coded LCK-GFP images. The images demonstrate the complex subcellular structures associated with membrane-rich vesicles and cell membrane borders of the fecundity cells. The Z-slice scales mark the position of the current image. For panels f–j: green arrow: cell membrane; red arrows: large membrane aggregate adjacent to fecundity cells; white arrows: solitary membrane aggregate in the cytoplasm. Bars equal 20 μm. C Key morphological characteristics of type 1 and type 2 organoids and the corresponding structures in patient tumors. From right to left: Live-cell imaging, phase contrast, fixed organoids, H&E-stained, bright field; Live-cell imaging, fluorescence laser confocal. LCK-GFP: green; H2B-mCherry: magenta; Fixed patient tumor tissue, wide-field epifluorescence. Immunofluorescence staining includes Na + /K + ATPase (epithelial cell membrane, red), Vimentin (mesenchymal cells, green), and DAPI (DNA, blue). Cyan arrow: giant nucleus; green arrows: fecundity cells. Bars equal 20 μm.

