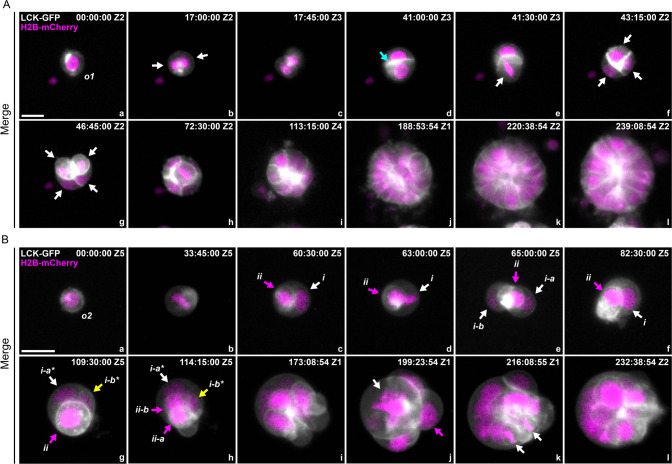
Fig. 2. Development pathway of type 1 and type 2 organoids.
Spatiotemporal view of development from a single cell to a multicellular organoid. Gray: cell membrane, LCK-GFP. Magenta: nuclei, H2B-mCherry. A The development of a type 1 organoid is dominated by canonical mitosis without forming any prominent fecundity cell structure. The sphere exhibits typical glandular features with relatively uniform cells. The original single cell is labeled o1. White arrows: original cell and its progeny cells; cyan arrow: cell-cell boundary. B The development of a type 2 organoid involves generating fecundity cells and forming complex tissue structures with pleomorphic nuclear morphology. The original single cell is labeled o2. The roman letters i and ii denote the daughter cells. The suffixes -a and -b indicate their generation; the suffixes -a* and -b* indicate the two daughter cells from the second round of mitosis. c–f White arrows: host PGCC, magenta arrows: fecundity cells. g, h White arrows: host PGCC; Magenta arrows: fecundity cell at metaphase and its daughter cells.; yellow arrows: a new fecundity cell (cell i-b*) generated from mitosis of cell-i. j White arrow: giant chromosome assembly at metaphase in the host PGCC; magenta arrow: released fecundity cell. k White arrows: bipolar mitotic figure from a daughter cell. The time format is hours: minutes: seconds. Bars equal 20 μm.

