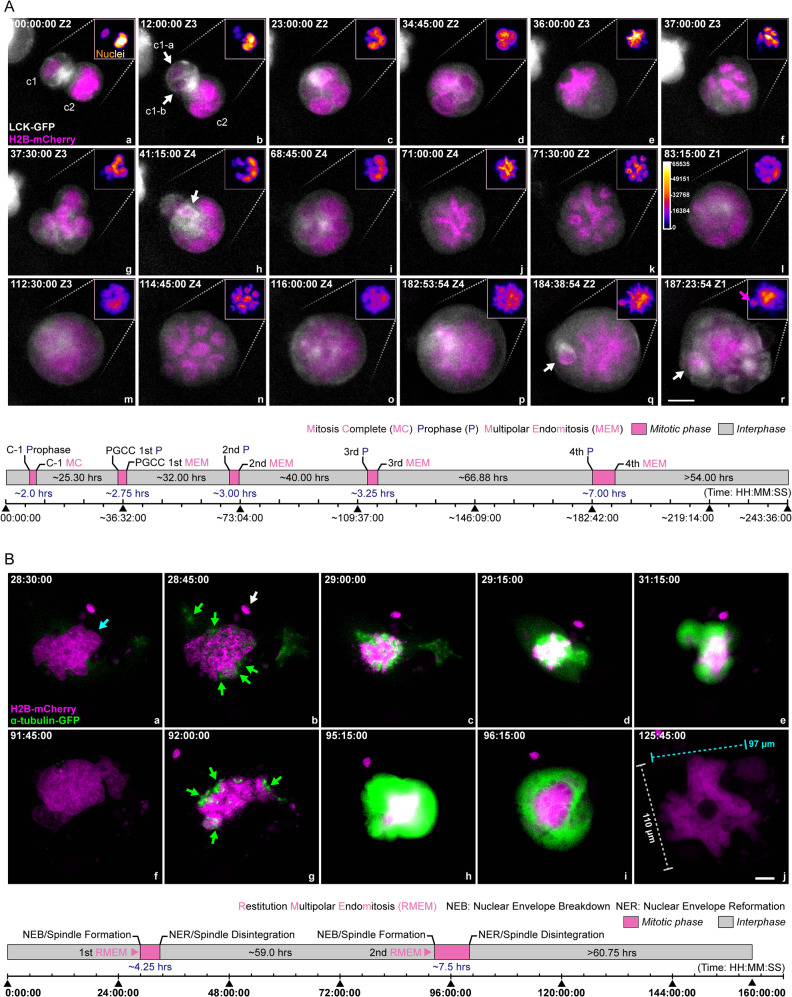
Fig. 3. Multipolar endomitosis (MEM) and restitution multipolar endomitosis (RMEM).
A A representative MEM event with partial cellularization. Following entosis, the two nuclei synchronized in cell cycles. The new PGCC underwent multiple endomitotic events followed by karyokinesis and internal cellularization to generate fecundity cells. Gray: cell membrane, LCK-GFP. Magenta: nuclei, H2B-mCherry. The two initially adherent cells are labeled as c1 (smaller cell) and c2 (host PGCC), and the progeny daughter cells of cell c1 are labeled as c1-a and c1-b (white arrows in panel b). The white arrow in panel h, fecundity cell generated during the first round of MEM; white arrows in panels q and r, fecundity cell generated during the fourth round of MEM; magenta arrow in panel r, chromatin aggregate encapsulated by a plasma membrane pocket. (Bottom panel) Schematic illustration of cell proliferation kinetics. The mitotic phase’s length was defined by the time interval between the start of prophase and the next nuclei re-formation. The time format is hours: minutes: seconds. Z with numbers indicates the z-slice position of the current image. Bar equals 20 μm. B A representative RMEM event was observed under a 2D condition. The spindle assembly indicates restitution mitosis (showing intensive green fluorescence) without complete separation of the condensed chromosomes. a–j Magenta: H2B-mCherry. Green: α-tubulin-GFP. Cyan arrow: giant pleomorphic nucleus; green arrows: dispersed spindle assemblies; white arrow: a micronucleus. (Bottom panel) Schematic illustration of cell proliferation kinetics. The time format is hours: minutes: seconds. Bar equals 20 μm.

