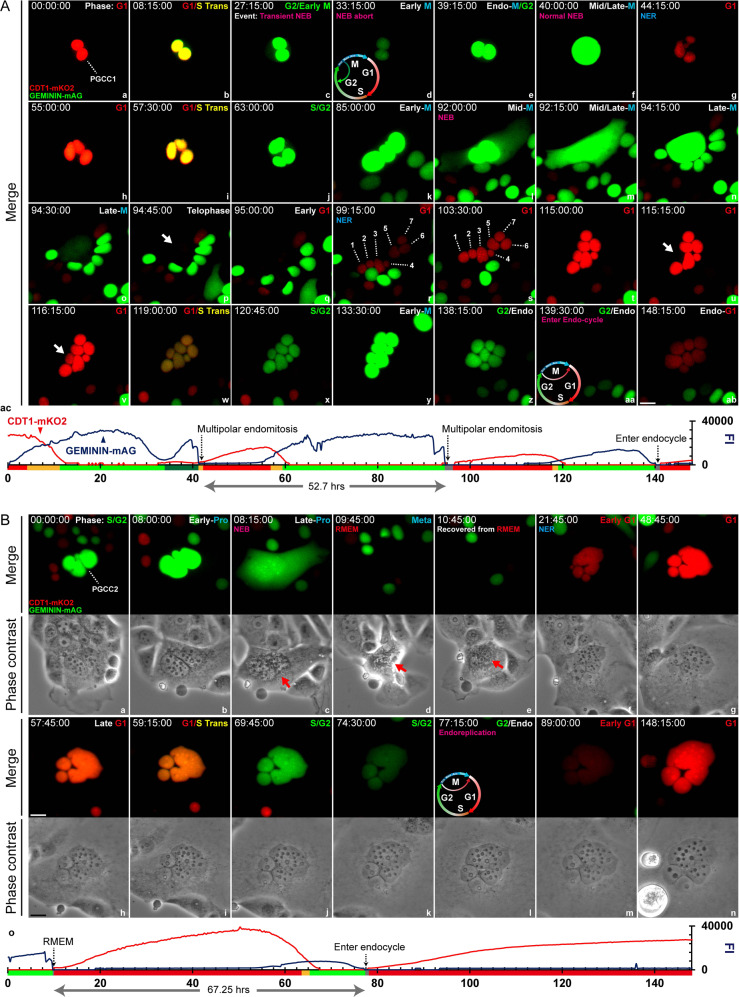
Fig. 4. PGCC cycle dynamics of MEM and RMEM.
A The time-series images demonstrate giant cell cycle configurations that underlie MEM. a-ab. Time-series images of FUCCI-labeled MDA-HGSC-2414 cells over approximately 148 h. G1 phase marker: CDT1-mKO2, red; S/G2/M phase marker: GEMININ-mAG, green; G1/S transition period: yellow. NEB nuclear envelope breakdown, NER nuclear envelope recovery, G1 G1 phase, G1/S Trans G1/S transition, G2 G2 phase, M metaphase. ac A line chart shows the dynamic fluctuations of the G1/G2-dependent fluorescence intensity (FI). The time format is hours: minutes: seconds. Bar equals 20 μm. B Time-lapse images of a PGCC underwent RMEM. a–n Time-lapse images of FUCCI-labeled MDA-HGSC-2414 cells over approximately 148 h. Phase contrast images are shown below the corresponding fluorescence images. The experimental procedures and color-rendering methods are consistent with those in panel A. o Same as A, panel ac. Bars equal 20 μm.

