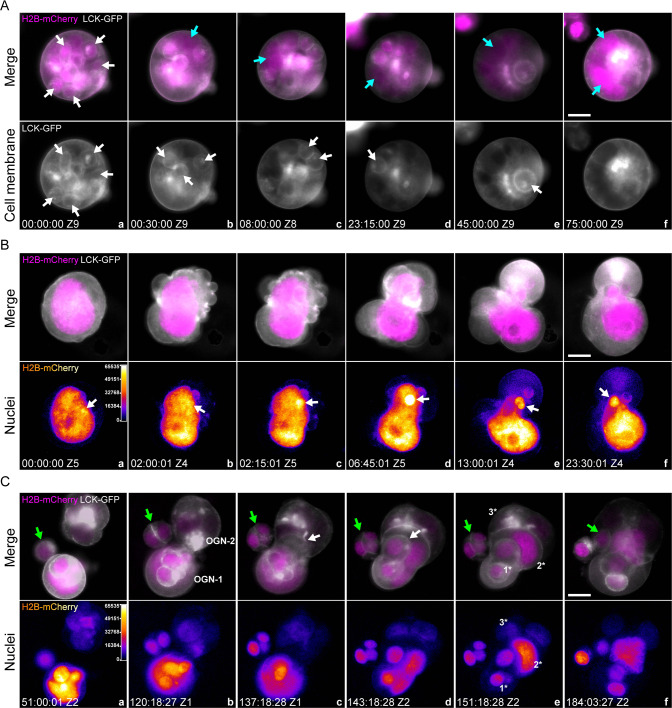
Fig. 5. Decellularization, cellularization, and entosis of PGCCs.
A Multiple fecundity cells in a type 2 organoid were decellularized. Gray: cell membrane, LCK-GFP. Magenta: nuclei, H2B-mCherry. Grayscale images of LCK-GFP fluorescence for visualizing the cell membrane envelopes of the host PGCC and its fecundity cells. White arrows in panel a point to a representative fecundity cell. Cyan arrows in panels b–f point to the giant nucleus generated by the released nuclei from the fecundity cells via nuclear fusion. The time format is hours: minutes: seconds. Bar equals 20 μm. B An amitotic mechanism (nuclear budding) generates a fecundity cell in a mononucleated PGCC. a–f Top panels, Gray: cell membrane, LCK-GFP. Magenta: nuclei, H2B-mCherry. a–f Bottom panels: Color-coded images of H2B-mCherry fluorescence. The regions of high fluorescence intensity indicate the locations of the formation of fecundity cells. White arrows: the extruding chromatin aggregate on the giant nucleus. The time format is hours: minutes: seconds. Bar equals 20 μm. C Time-lapse images demonstrate entosis events between two type 2 organoids. Top panels: merged fluorescence images of the cell membrane (LCK-GFP, grayscale) and nuclei (H2B-mCherry, magenta). Bottom panels: color-coded H2B-mCherry fluorescence images for monitoring nuclear status, such as condensed chromosomes. Z1 and Z2 indicate the Z-slice position of the current image. Green arrows: diploid cells gradually migrated to the organoids; white arrows: the “invasion front” of the OGN1 after infiltrating OGN2. Three prominent layers of the fecundity structure are marked by 1*, 2*, and 3*. The time format is hours: minutes: seconds. Bars equal 20 μm.

