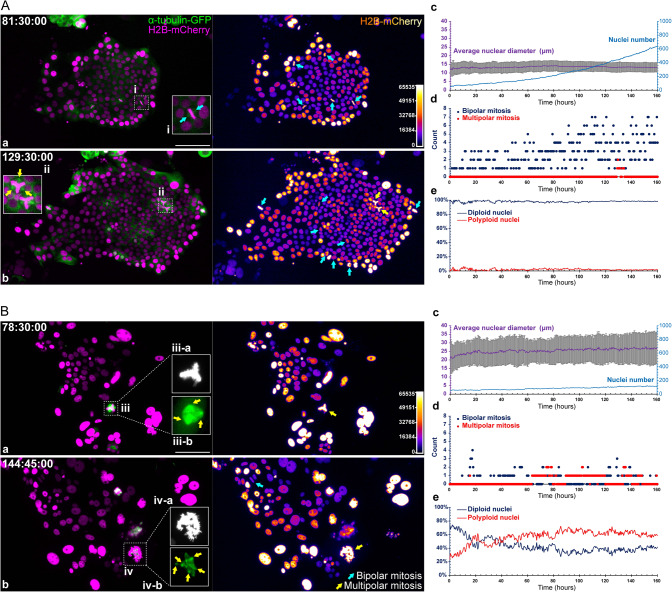
Fig. 6. Cell proliferation kinetics sustaining the growth of type 1 and type 2 organoids.
A Cell proliferation kinetics of a type 1 organoid with minimal PGCCs. a, b (left panels) spindles (α-tubulin-GFP, green) and nuclei (H2B-mCherry, magenta). a, b (right panels) Corresponding color-coded images for H2B-mCherry fluorescence, indicating relative DNA contents. Insets i show typical mitotic figures of canonical mitosis. Inset ii shows tripolar open mitosis (cyan arrows). The time format is hours: minutes: seconds. Bar equals 100 μm. c–e Quantitative analyses from the time-lapse images. c Dynamic change in average nuclear diameter (left y-axis) and absolute nuclear number (right y-axis). The data represent the mean ± S.D. for the average nuclear diameter values. d Distribution of the mitotic event incidence (the numbers of all observed mitotic events, including bipolar and multipolar types, on the analyzed image) during the expansion of the cell colony. e Percentages of diploid and polyploid nuclei during organoid growth. B Cell proliferation kinetics of a type 2 organoid with abundant PGCCs. The composition, layout, and measurements are consistent with A. Inset iii series represents a tripolar mitotic event; inset iv series represent a multipolar mitotic event. The suffix -a indicates the H2B-mCherry fluorescence (grayscale), and the suffix -b indicates the α-tubulin-GFP fluorescence (green).

