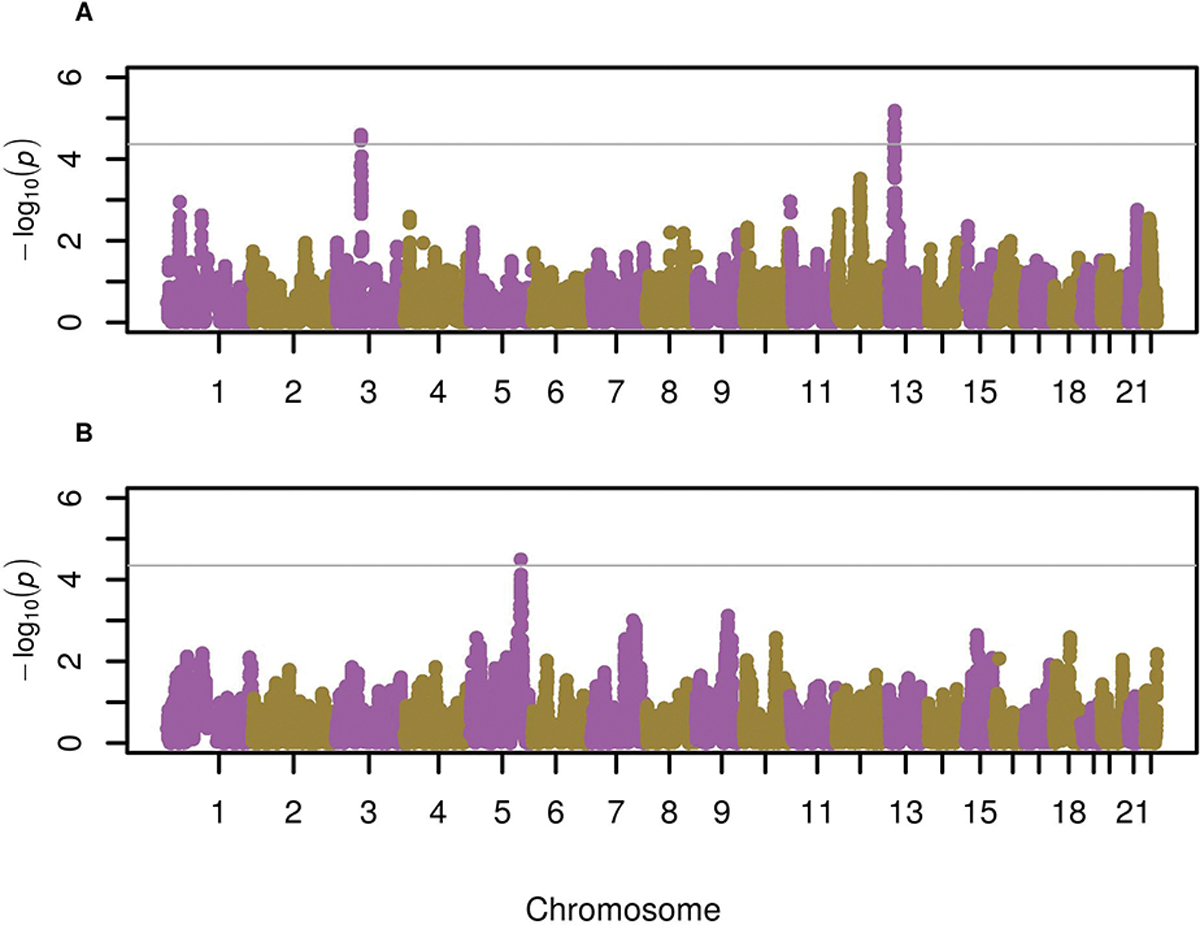
Figure 1. Manhattan plot for the admixture mapping results of severe exacerbations in participants with asthma from GALA II (2006–2014). A) Association results for Indigenous American ancestry in Puerto Ricans B) Association results for Indigenous American ancestry in Mexican Americans.

The association with local ancestry is represented as −log10 p-value on the y-axis along the chromosomes (x-axis). The threshold for significance (grey line) was defined as p<0.05/sum of the two largest values for the effective number of ancestry blocks: p≤4.33×10⁻⁵ in Puerto Ricans, accounting for 1,154 ancestry blocks (African: 560, European: 594, Native American: 432); and p≤4.51×10⁻⁵ in Mexican Americans, accounting for 1,107 ancestry blocks (African: 637, European: 470, Native American: 431).
