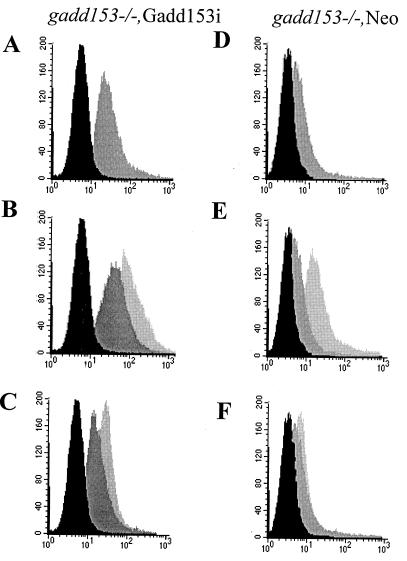
FIG. 9.
Conditional expression of Gadd153 increases oxidative stress. ROS production was examined in gadd153−/− Gadd153i cells, which conditionally express Gadd153 (A, B, and C), and in gadd153−/− Neo cells, which are vector control cells (D, E, and F), using H2DCF dye and flow cytometry. (A and D) Cells were treated with IPTG (dark gray peak) or with a vehicle control (black peak). Significant ROS production was observed in response to Gadd153 induction (A) but not in IPTG-treated control cells (D). (B and E) Following pretreatment with IPTG or vehicle control, cells were exposed to tunicamycin (TN; 1 μg/ml, 12 h). The black peak represents fluorescence in untreated control cells (−IPTG, −TN). The dark gray peak corresponds to tunicamycin-treated cells lacking Gadd153 (−IPTG, +TN), while the light gray peak corresponds to ROS production in IPTG-pretreated cells exposed to tunicamycin (+IPTG, +TN). Tunicamycin treatment increased ROS production in both cell lines, but ROS production was maximal in Gadd153-expressing cells treated with tunicamycin. (C and F) Following pretreatment with IPTG or vehicle control, cells were exposed to thapsigargin (TG; 1 μM, 12 h). The black peak represents fluorescence in untreated cells (−IPTG, −TG). The dark gray peak corresponds to thapsigargin-treated cells that were not pretreated with IPTG (−IPTG, +TG), while the light gray peak corresponds to cells receiving IPTG followed by thapsigargin (+IPTG, +TG). Maximal ROS production was again detected in Gadd153-expressing cells treated with thapsigargin. All experiments were repeated three times and representative histograms are shown.

