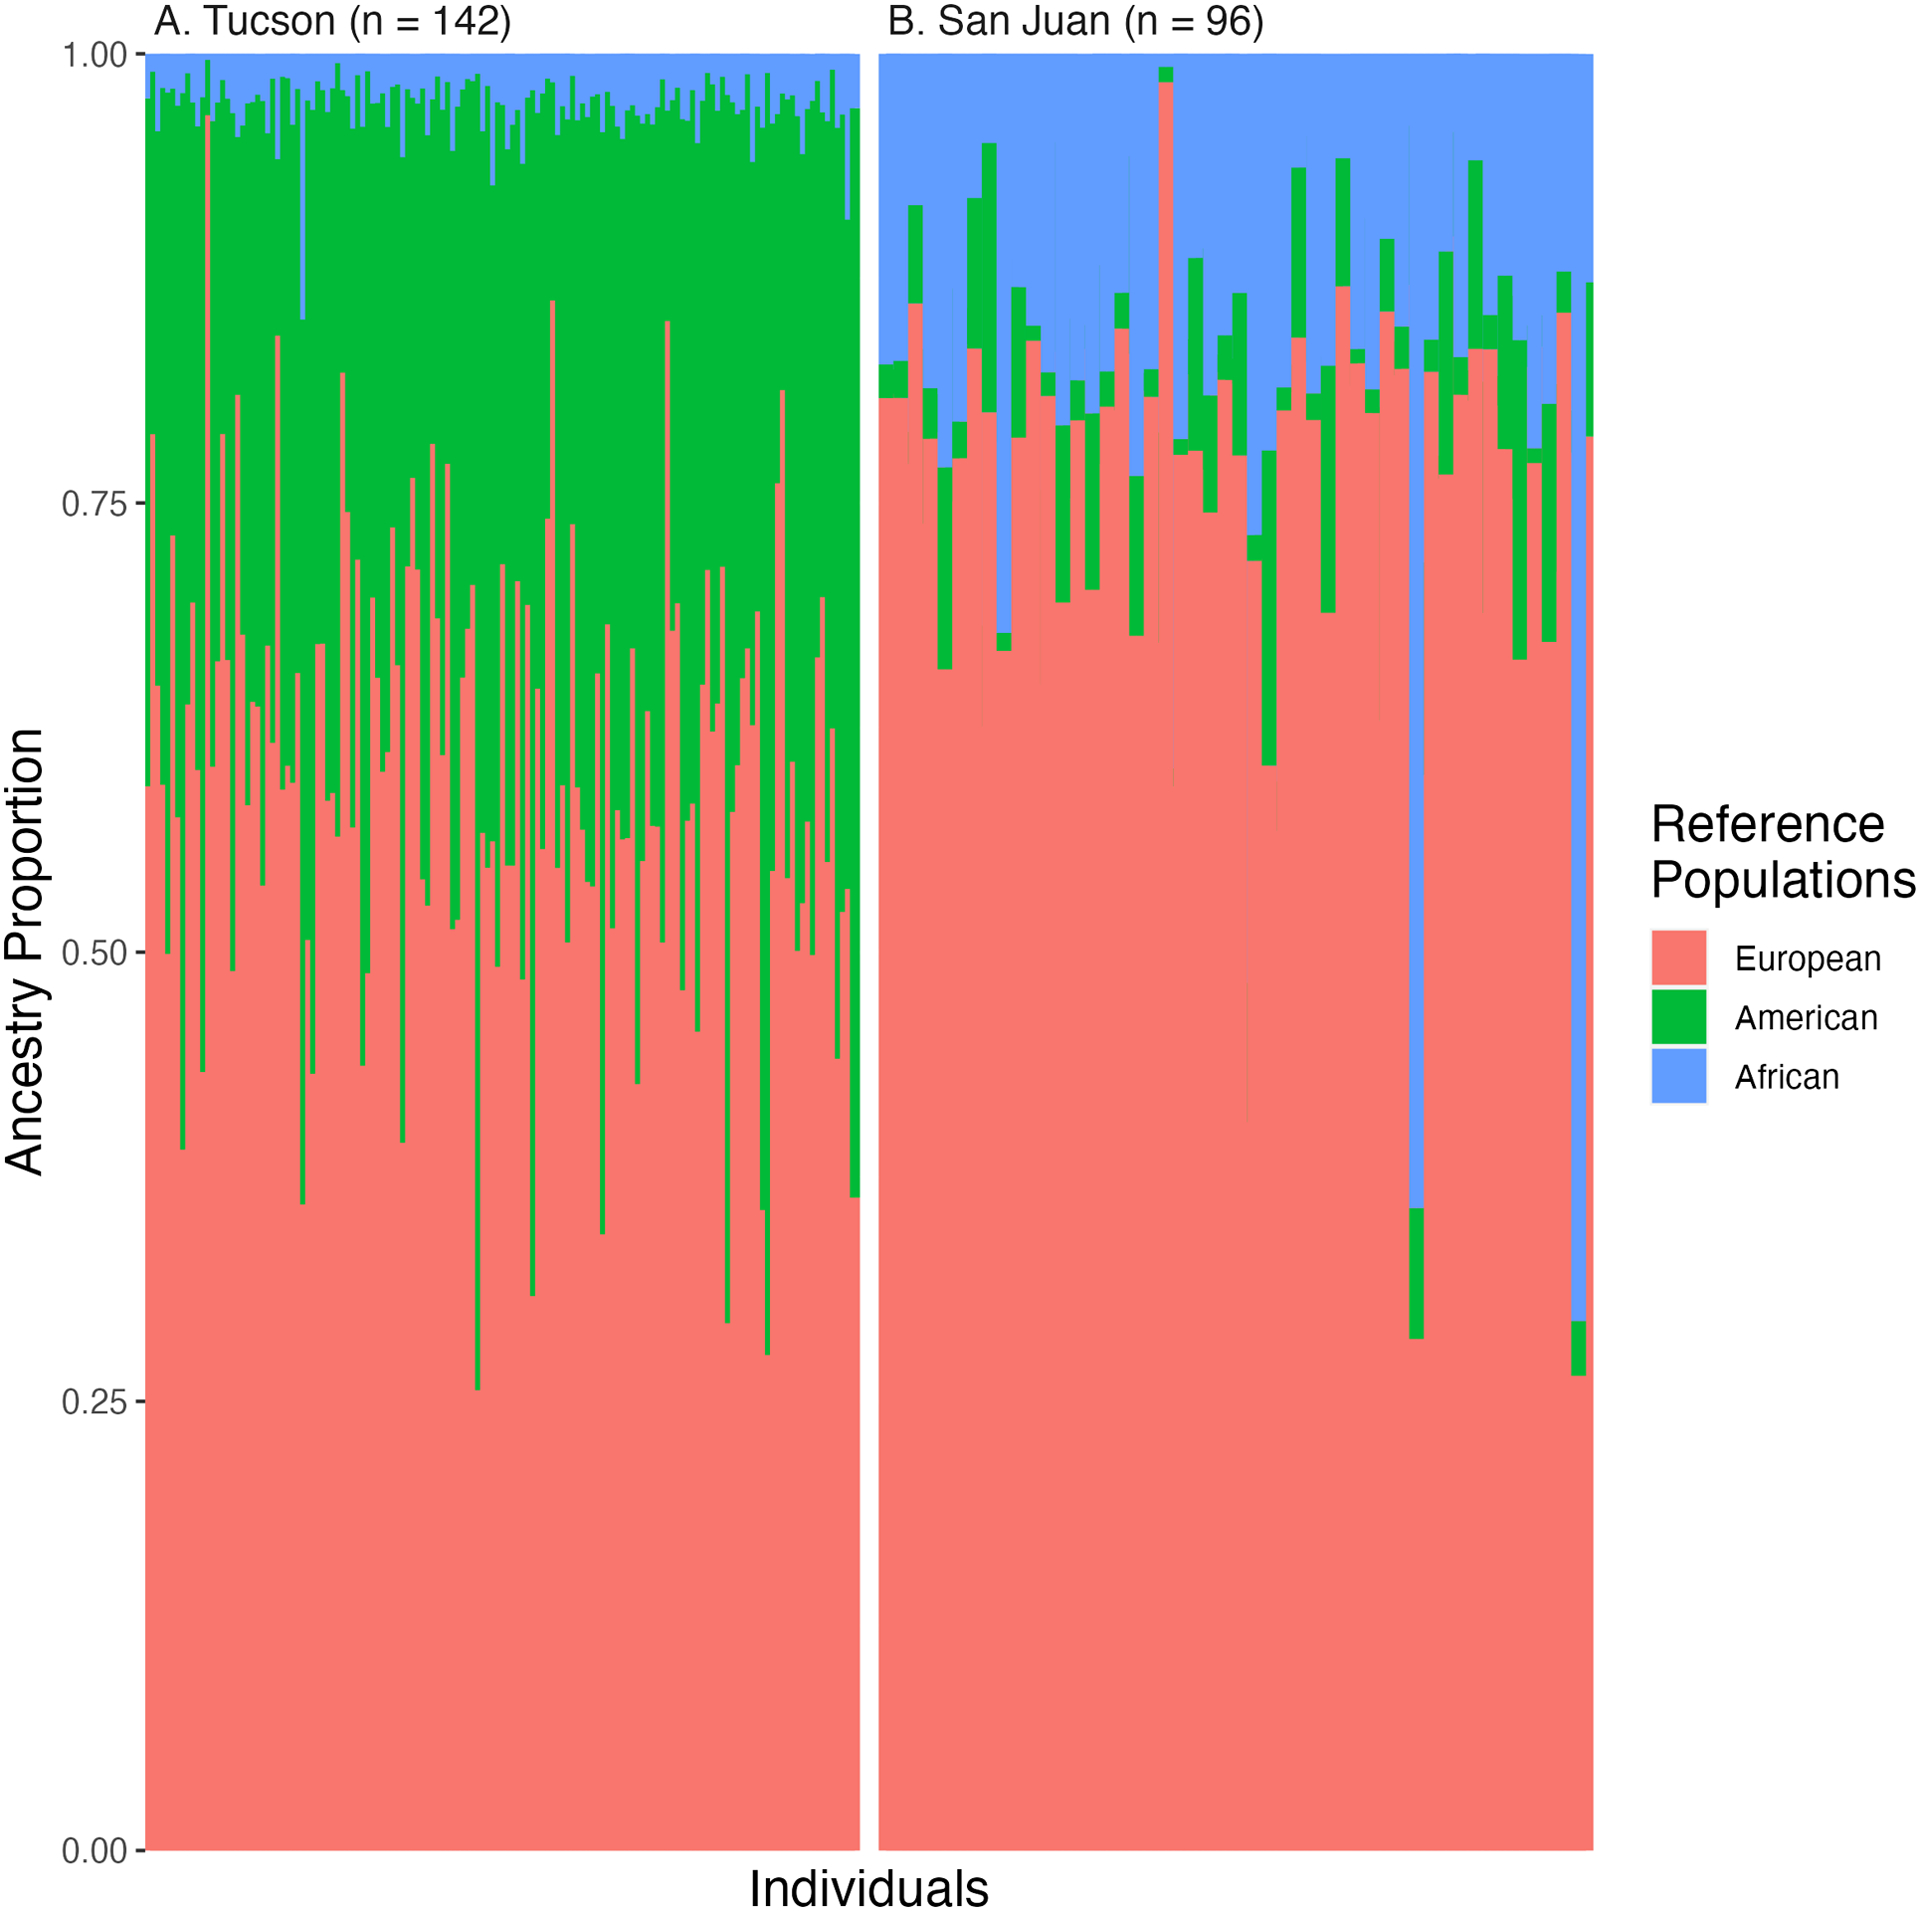
Figure 1.

Global ancestry proportions per individual in the A) discovery and B) replication cohort as produced by RFMix_v2 when using references from Europeans of the Iberian Peninsula (Purple), Africans of Yorubaland (Yellow), and Indigenous Americas (from multiple ethnic groups, Green) as reference. The x-axis represents individuals while the y-axis represents proportions of each ancestry which are shown in contrasting colors.
