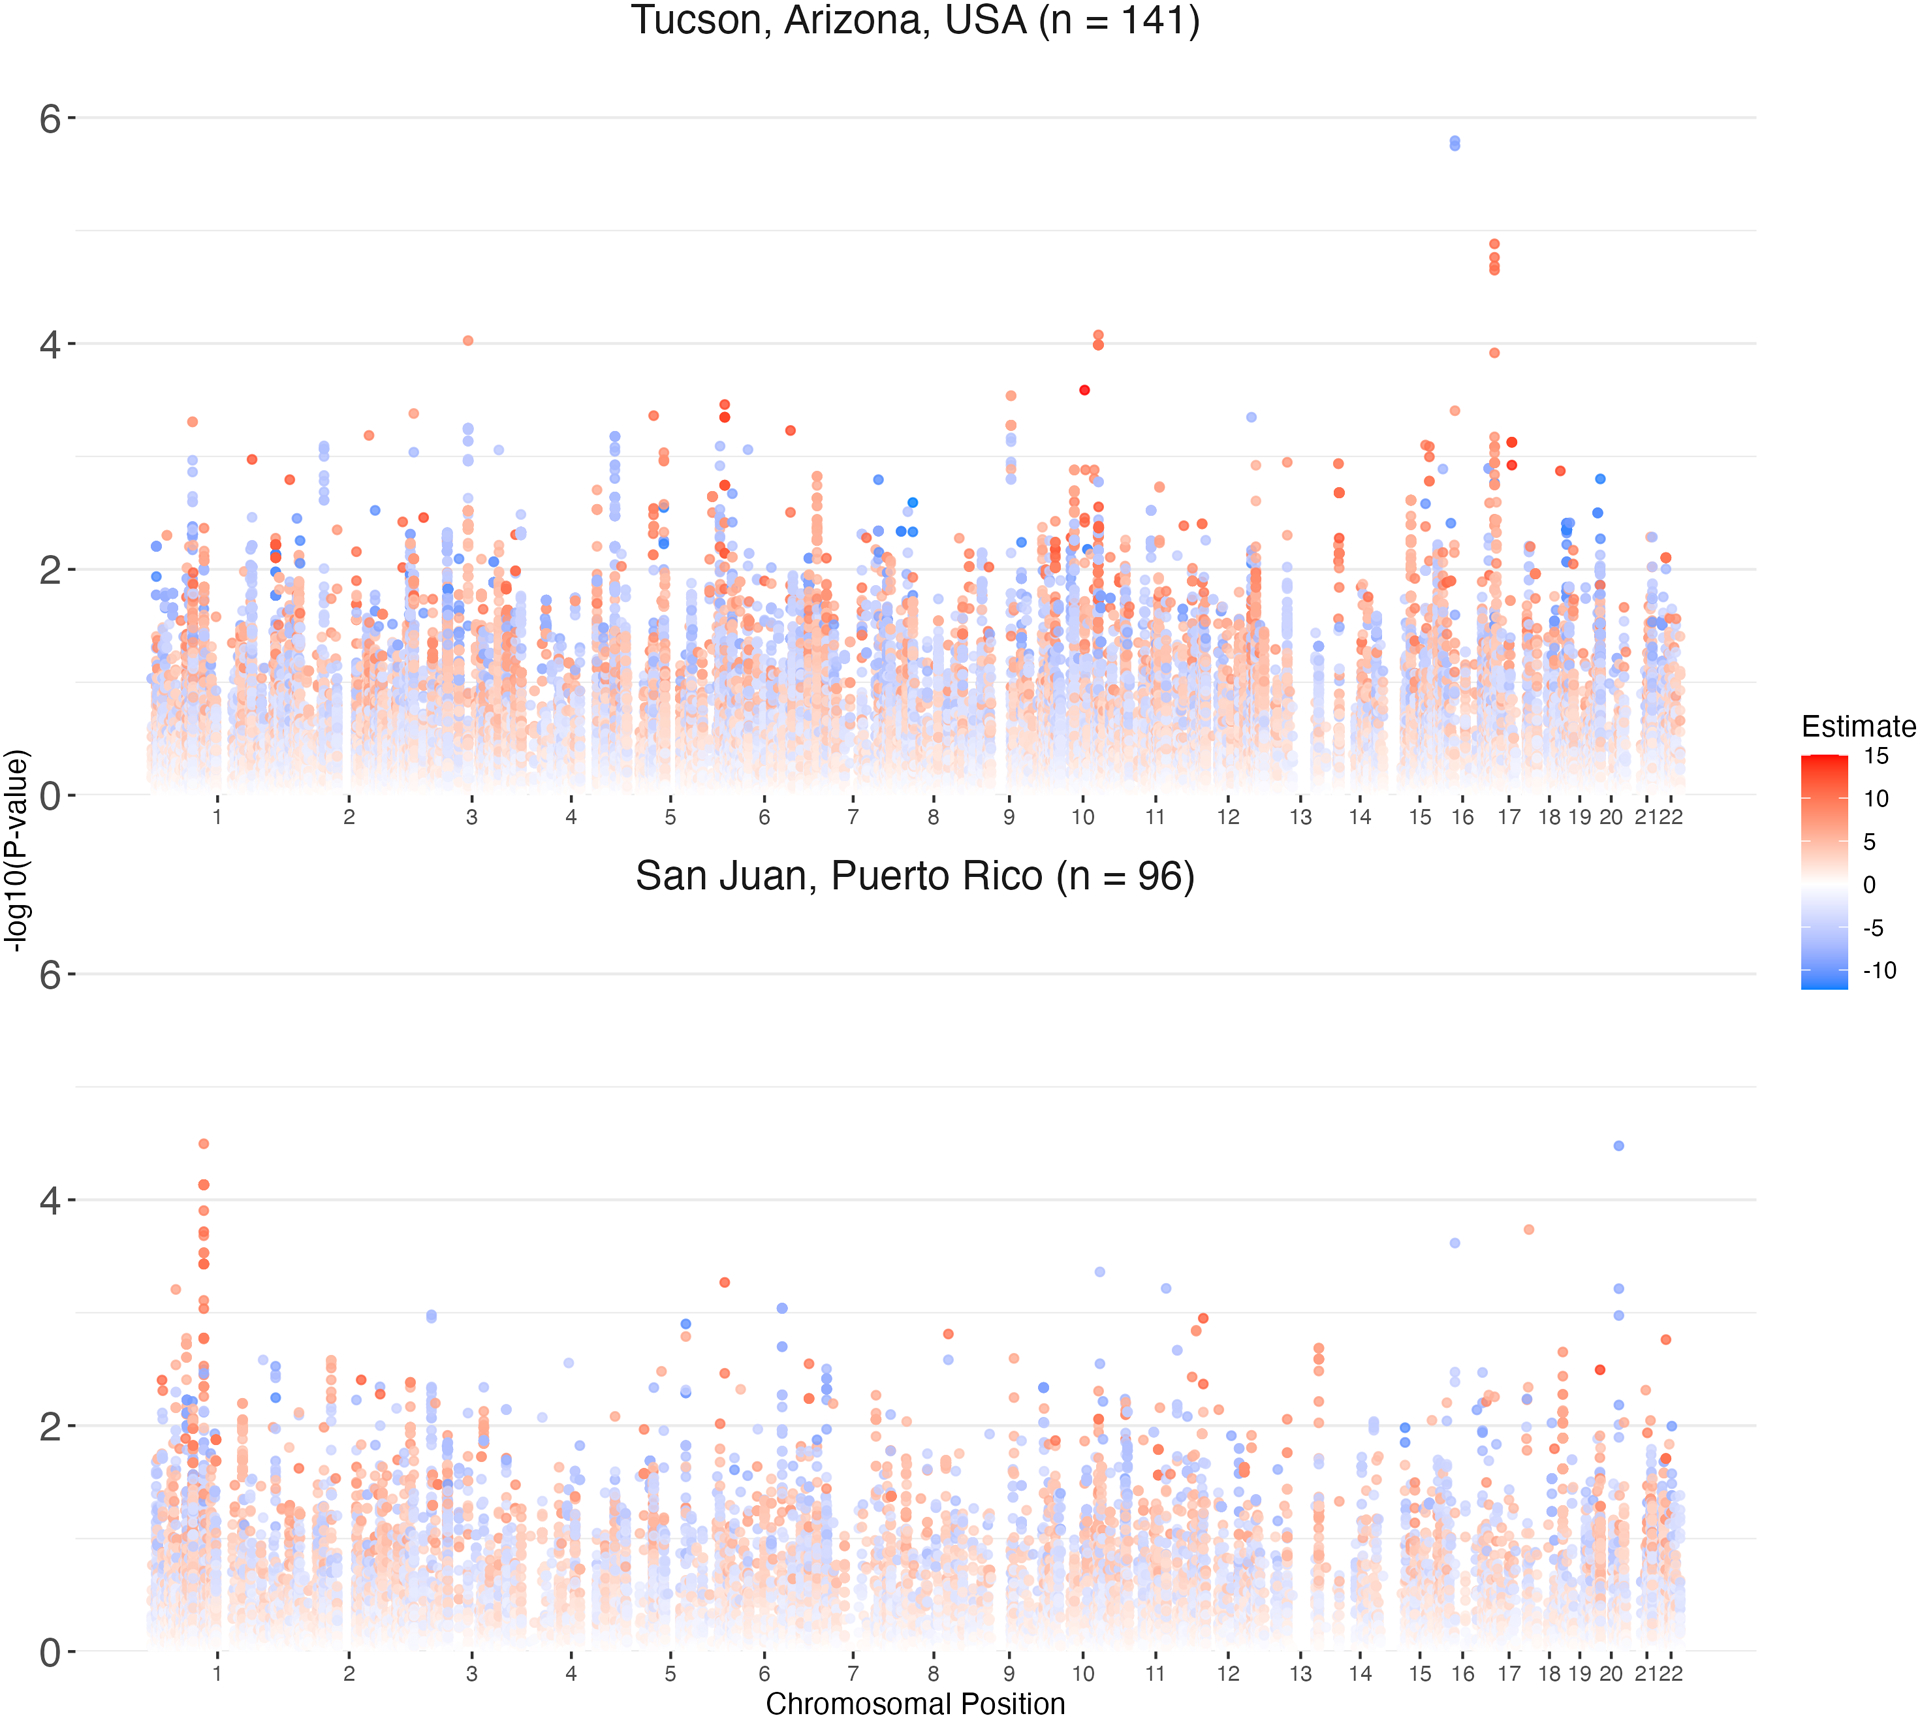
Figure 2.

Manhattan plots of linear regression significance values from vitamin K-pathway related variants on warfarin dose in the A) discovery and B) replication cohort. The x-axis represents chromosomal location while the y-axis represents significance of the association (−log10[p value]). Each dot is a variant tested for an association with stable warfarin dose and the color of each dot represents the effect size of the association where blue and red colors are negative and positive effects, respectively.
