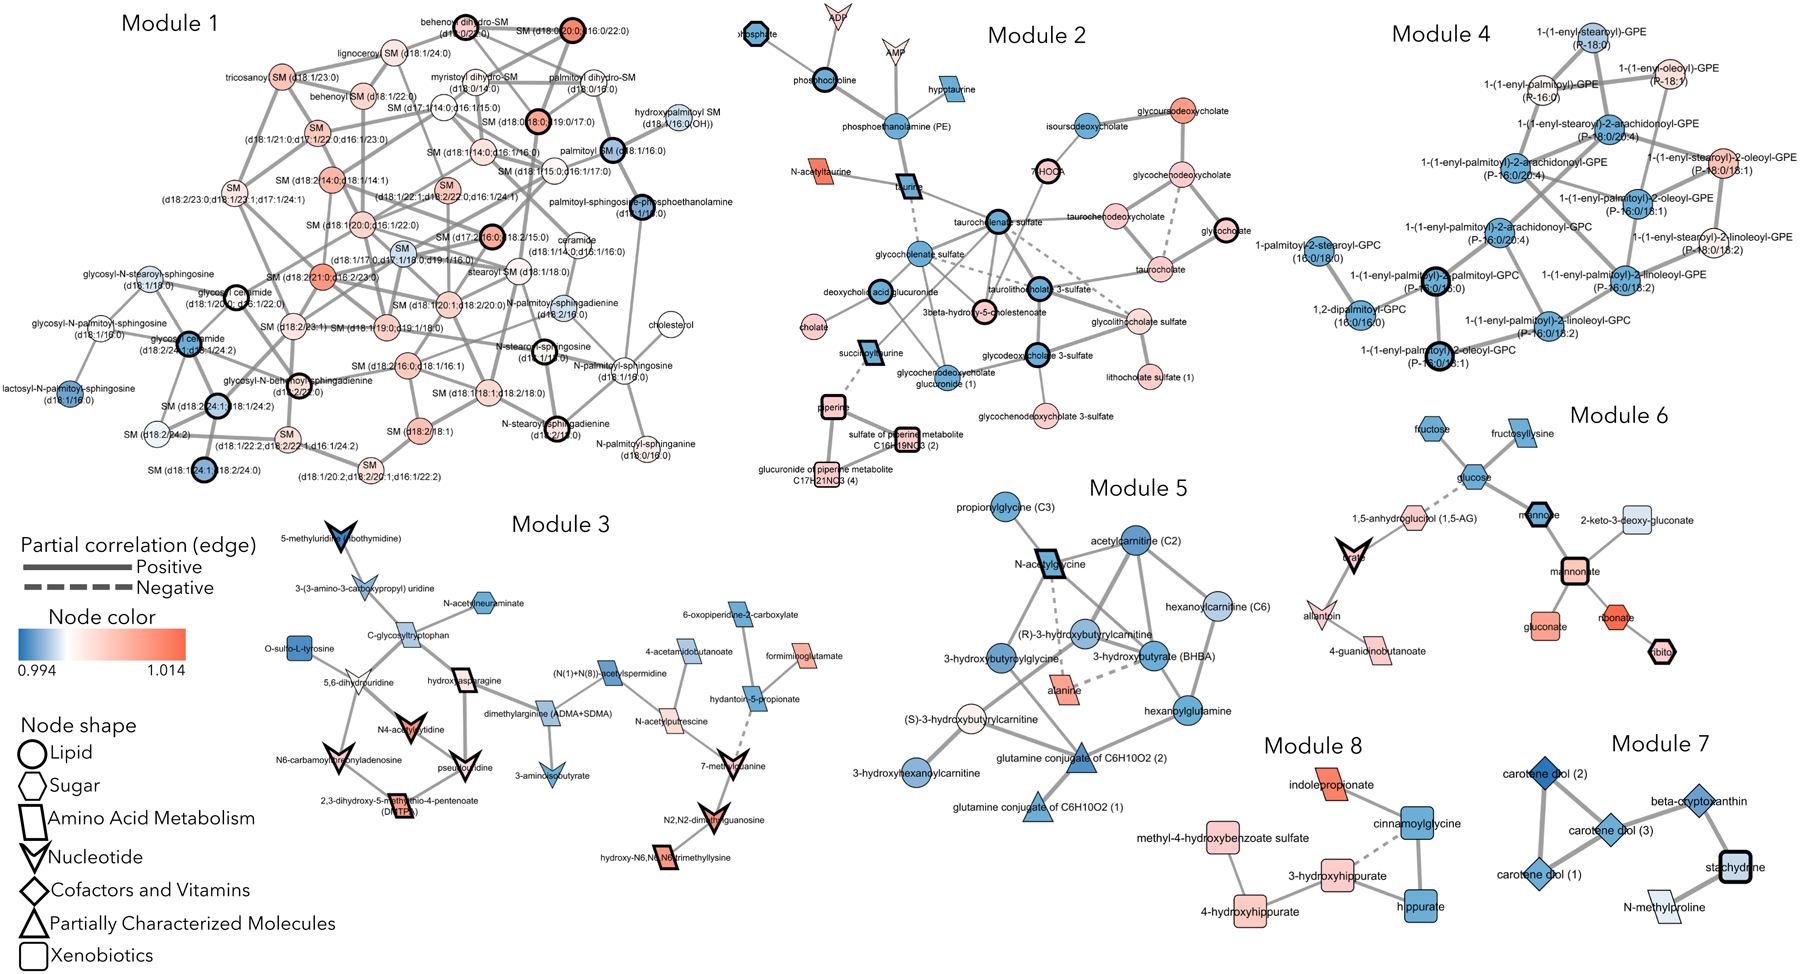
Figure 2. Metabolic Modules Associated with BMI Trajectory.

Eight metabolic modules containing 152 total metabolites associated with BMI trajectory in group lasso regression models. Node color indicates odds ratio (OR) from group lasso; OR>1 indicates association with the increase BMI cluster (red node), OR<1 indicates association with the decrease BMI cluster (blue node). Nodes with a bold border significantly correlate with current BMI (FDR < 0.05). Node shape indicates the sub-pathway a metabolite belongs to. Solid edge between metabolites indicates positive partial correlation coefficient, dashed edge indicates negative partial correlation coefficient.
