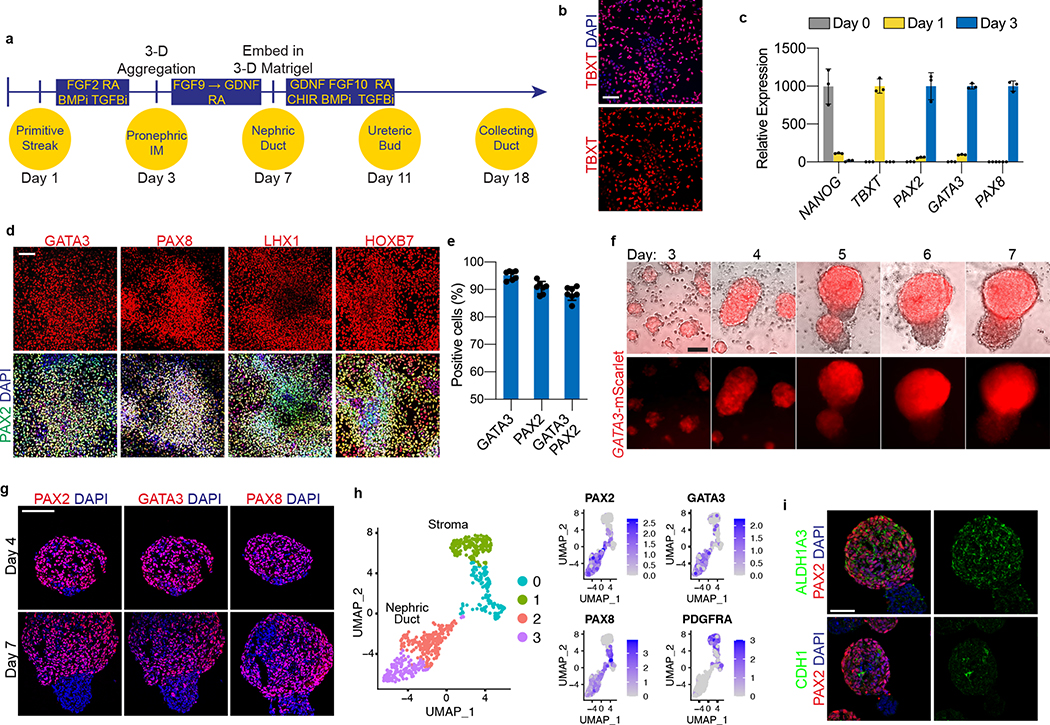
Figure 1. Directed differentiation of hPSCs into pronephric IM and nephric duct spheres.
a, Schematized diagram of stepwise differentiation strategy for generation of ureteric bud and collecting duct organoids. b, Immunofluorescent (IF) staining of monolayer cultures at day 1 revealed efficient induction of TBXT-expressing mesendodermal progenitor cells. c, Gene expression analyses by qPCR revealed dynamic down- and up-regulation of pluripotency (NANOG) and primitive streak (TBXT) markers, respectively, after one day of induction. Following two subsequent days of exposure to IM-inducing factors, TBXT was repressed and there was robust activation of PAX2, PAX8, and GATA3. n=3 independent biological replicates per timepoint. d, IF staining of day 3 monolayer cultures demonstrated a high proportion of cells with co-expression of pronephric IM genes PAX2, PAX8, GATA3, LHX1, and HOXB7. e, Quantification of staining for GATA3 and PAX2 represented on histogram revealed a high efficiency of differentiation into pronephric IM fate. n=7 quantified fields from 3 independent biological replicates. f, Following aggregation of IM cells at day 3, the resulting structures underwent stereotypic morphogenetic events characterized in the timecourse of stereomicrographs and fluorescent imaging using GATA3-mScarlet reporter. By day 7, the GATA3+ cells arranged into a dense sphere that excluded a minority population of negative cells. g, IF staining of sections of nephric duct spheres at days 4 and 7 demonstrated maintenance of expression of PAX2, PAX8, and GATA3. h, UMAP representing scRNA-seq of cells isolated from spheres at day 7, which demonstrated the presence of both nephric duct (clusters 2 and 3) and stromal (clusters 0 and 1; PDGFRA+) lineages. i, The majority of cells at day 7 expressed the nephric duct leader fate marker ALDH1A3 with low levels of the mature epithelial marker CDH1. Scale bars 100 μm (b and d), 50 μm (f, g and i). Column and error bars represent mean and standard deviation, respectively.

