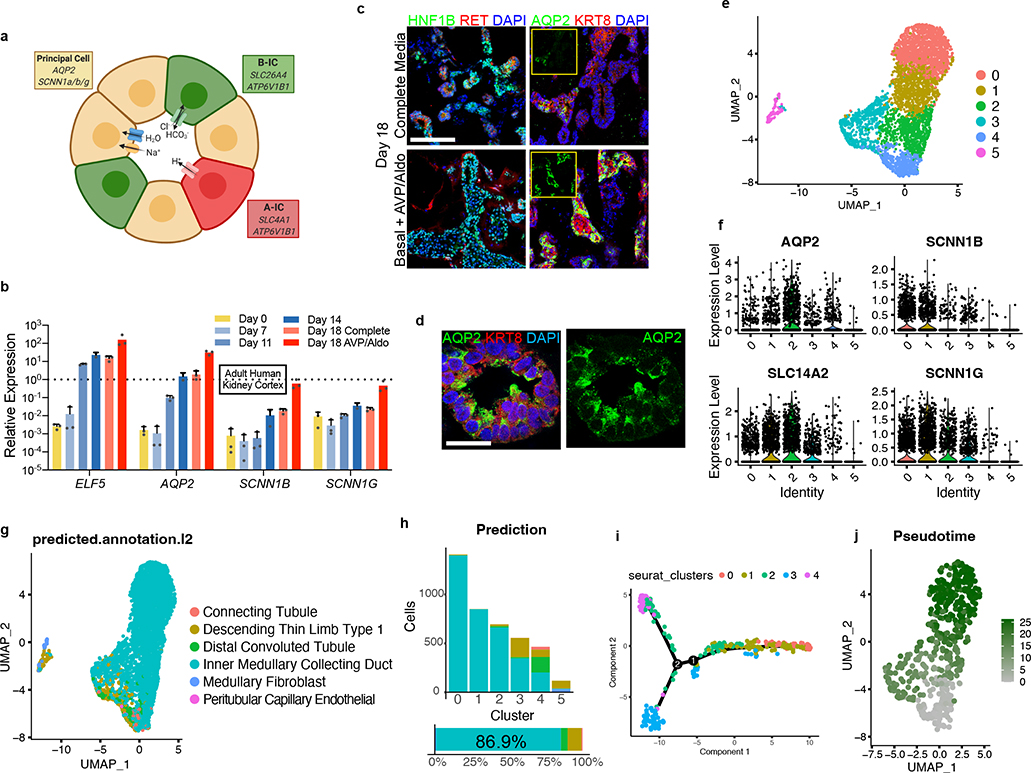
Figure 3. Differentiation of collecting duct epithelia from UB organoids.
a, Illustration demonstrating that the collecting duct epithelia comprise a mixture of principal cells, A-type, and B-type intercalated cells. b, Expression of markers ELF5, AQP2, SCNN1B, and SCNN1G increased over time, consistent with spontaneous formation and maturation of principal cells. When organoids were transitioned to a basal medium containing only AVP (10 nM) and Aldosterone (10 nM) from days 14–18, there was a marked increase in the expression of each of these genes. Dotted line represents expression observed in a sample of human kidney cortex. n=3 independent biological replicates per timepoint/condition. c, When the UB organoids were transitioned to the basal medium (with AVP/Aldo), the progenitor marker RET was downregulated in the epithelial tip domains, while AQP2 expression became more widespread and expressed at strikingly higher levels by IF. d, In numerous instances, AQP2 was localized in the epithelia nearer to the luminal or apical membrane, albeit it was not strictly apically localized. e, UMAP of scRNA-seq analysis of day 18 organoids that were cultured for four days in basal media with AVP/Aldo. f, Violin plots demonstrate expression of principal cell markers in clusters 0–4, which appear to be related given close association on UMAP, but not in cluster 5. g-h, Accordingly, integration and reference mapping to adult human kidney dataset predicted an ‘inner medullary collecting duct’ in 86.9% of cells in the dataset. While clusters 0–2 were nearly uniformly mapped to a collecting duct fate, clusters 3 and 4 contained a small proportion of cells that mapped to alternative tubular fates, namely the descending thin limb and distal convoluted tubule. i-j, Lineage trajectory analysis in Monocle predicted clusters 0 and 1 to be most differentiated cell types, while clusters 3 and 4 represented the earliest developmental stages in pseudotime. Scale bars, 100 μm (c) and 20 μm (d). Column and error bars represent mean and standard deviation, respectively.

