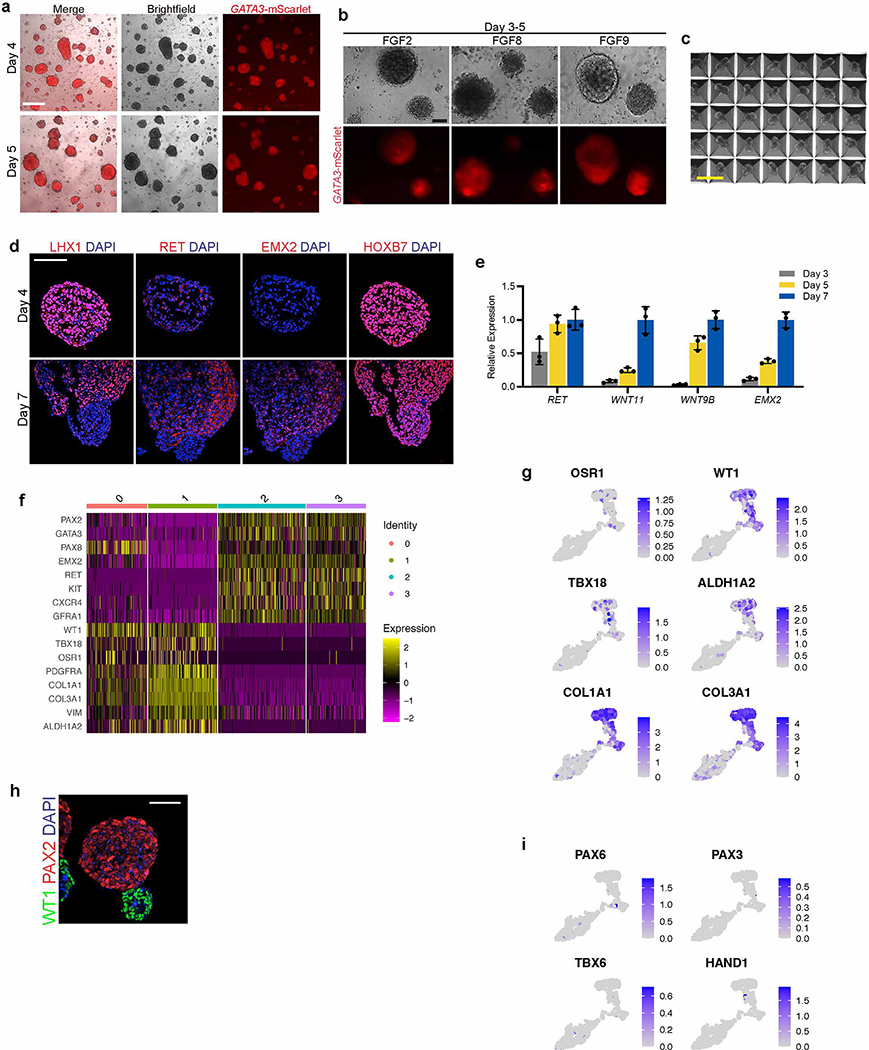
Extended Data Fig. 3. Characterization of nephric duct spheroids.
a, Pronephric IM cells aggregated at day 3 efficiently formed numerous compact spheroids that maintained high levels of GATA3 expression over the course of their development. b, When either FGF2 or FGF8 was used in place of FGF9 from days 3–5, the spheres were more loosely organized and exhibited lower expression of GATA3. c, Micrograph of a small region of nephric duct progenitors plated on a patterned microwell, demonstrating high degree of uniformity of size, shape, and structure of the spheroids. d, From days 4–7, the spheres maintained expression of early pronephric transcription factors LHX1 and HOXB7, and they also gradually acquired expression of nephric duct markers RET and EMX2. e, Over these several days of culture, qPCR analysis showed developmental increase in nephric duct genes RET, WNT11, WNT9B, and EMX2. n=3 independent biological replicates per timepoint. f, The leader cell marker ALDH1A3 was expressed in the ND clusters 2 and 3, while genes associated with more proximal ND (HOXB9 and TFAP2B) were less abundant. g-h, Heatmap and expression plots representing scRNA-seq data from day 7 revealed high expression of nephric duct markers in clusters 2 and 3, with complementary expression of stromal lineage genes in clusters 0 and 1 (in reference to UMAP in Fig. 1f). i, IF staining confirmed a high level of WT1-positivity in nephric duct lineage-negative cells at day 7. j, The differentiation of off-target lineages was not observed in the scRNA-seq dataset. Scale bars, 500 μm (a), 100 μm (b), 400 μm (c), 50 μm (d and h), 25 μm (i). Column and error bars represent mean and standard deviation, respectively.

