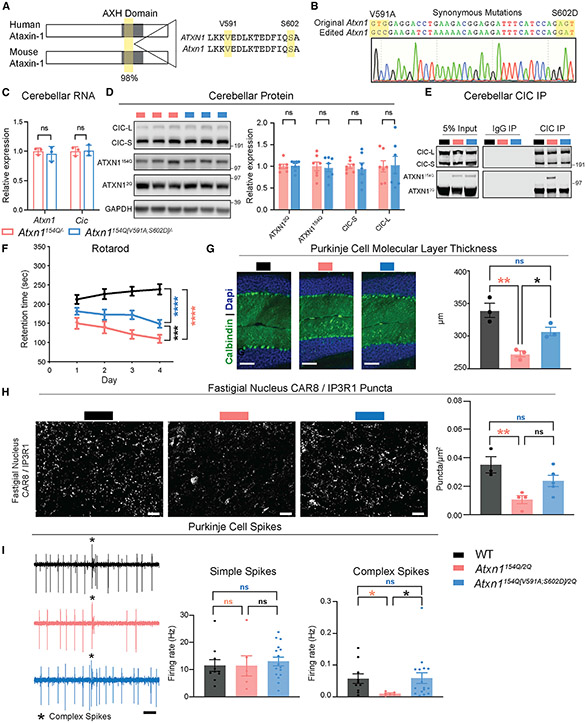
Figure 1. ATXN1-CIC complex is critical for SCA1 pathogenesis in cerebellar Purkinje cells.
(A) Conservation of ATXN1 AXH domain and amino acids V591 and S602 in human and mouse.
(B) Sanger sequencing confirming the correct mutation of V591 and S602 and synonymous mutations in Atxn1154Q[V591A;S602D]/2Q F1 offspring.
(C) Quantification of Atxn1 and Cic RNA levels in the cerebellum of mice at 4 weeks of age. Atxn1 and Cic were normalized to Gapdh, n = 3.
(D) Representative western blot and quantification of ATXN1 and CIC protein levels in the cerebellum of mice at 4 weeks of age. ATXN1 and CIC were normalized to GAPDH, n = 7.
(E) Representative western blot showing the pull-down of ATXN1 and CIC upon immunoprecipitation (IP) of CIC in cerebella of mice at 4 weeks of age.
(F) Rotarod assay in mice at 24 weeks of age. n = 9–14.
(G) Cerebellar Purkinje cells stained with DAPI and Calbindin at 40 weeks of age (original magnification ×20, scale bars, 100 μm) and quantification of the molecular layer thickness of the cerebellum in lobules V and VI, n = 3.
(H) Representative images of CAR8/IP3R1 expression in the fastigial nucleus (scale bars, 20 μm) and quantification of CAR8/IP3R1 puncta, n = 3–5.
(I) 1 s example recordings of Purkinje neuron firing. Scale bars, 0.1 s. Complex spike, * (left). Firing rate of Purkinje neurons simple spikes (middle) and complex spikes (right). n = 3, number of cells (c) = 6–16. t tests were used for (C) and (D); two-way ANOVA with Tukey’s multiple comparisons was used for (F); one-way ANOVAs with Tukey’s multiple comparisons were used for (G), (H), and (I). In each case, *, **, ***, ****, and ns denote p < 0.05, p < 0.01, p < 0.001, p < 0.0001, and p > 0.05, respectively. All data are represented as mean ± SEM. See also Figure S1.

