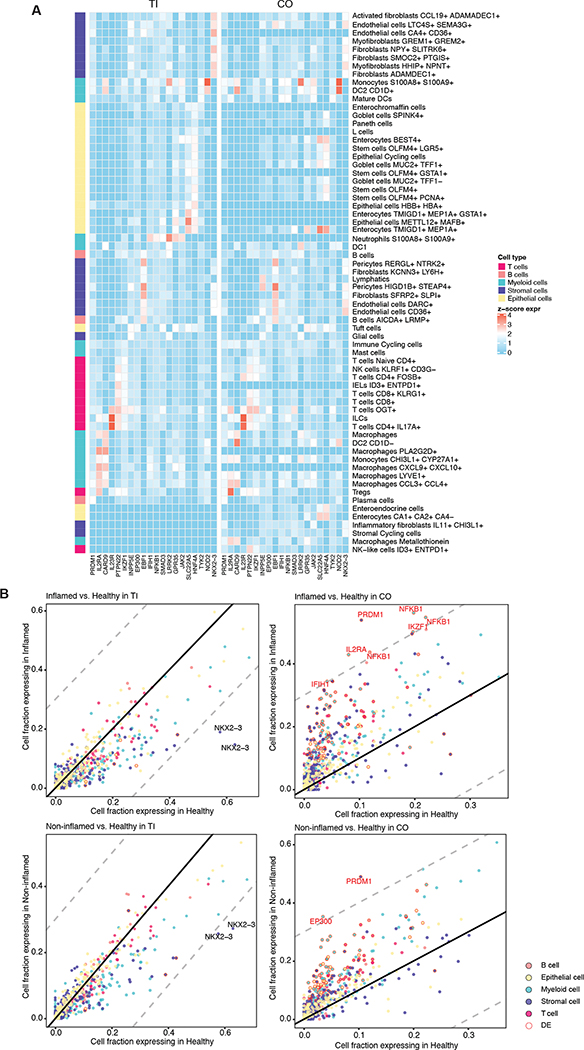
Figure 2. Expression profiles across cell types of core IBD risk genes.
(A) Scaled mean expression (Methods) of 20 core IBD risk genes in both TI and colon. (B) Fraction of cells from healthy, non-inflamed, and inflamed samples expressing core IBD genes for cell types with at least 200 cells available. Each point represents the fractions of cells within a cell type expressing that particular gene. Gene-cell type pairs with a difference in fraction of genes expressing greater than 0.3 (dashed lines) are labeled. Note that for readability, cell types are summarized to their category, causing some gene labels to be repeated for each specific cell type. Individually differentially expressed gene-cell type pairs (FDR<0.05) are highlighted (red).

