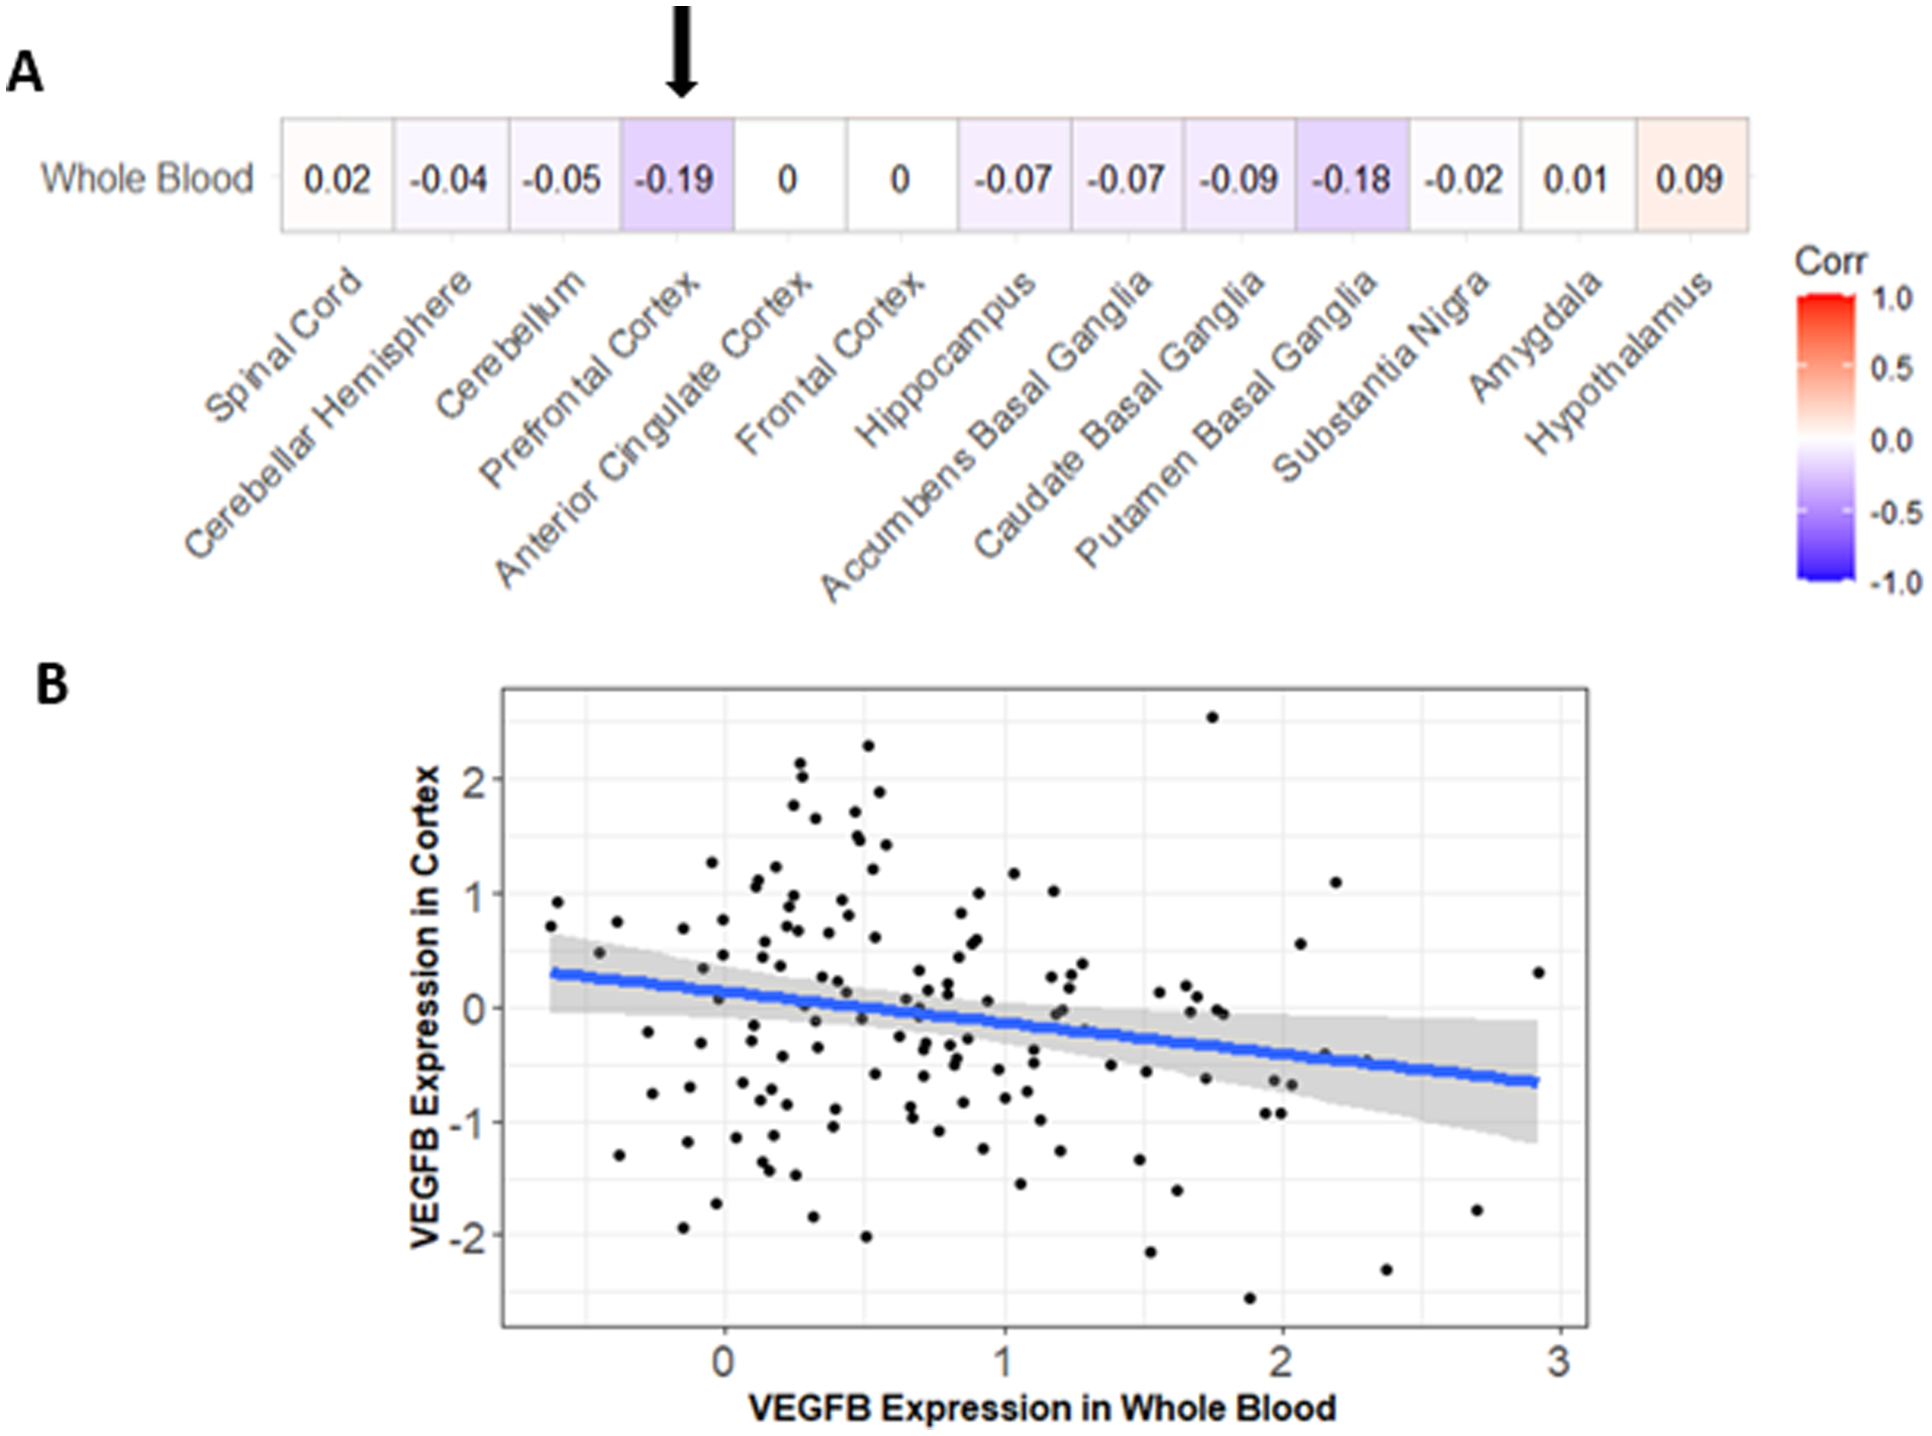
Figure 3. Correlation Between VEGFB Expression in Whole Blood and Brain Regions in GTEx.

Pearson correlations were calculated between VEGFB expression in various brain regions and whole blood within GTEx (A). The most significant correlation was between expression in the prefrontal cortex and whole blood, indicated by the arrow (A). Higher levels of VEGFB expression in whole blood were associated with lower levels of VEGFB expression in the prefrontal cortex (B). No other significant correlations were observed.
