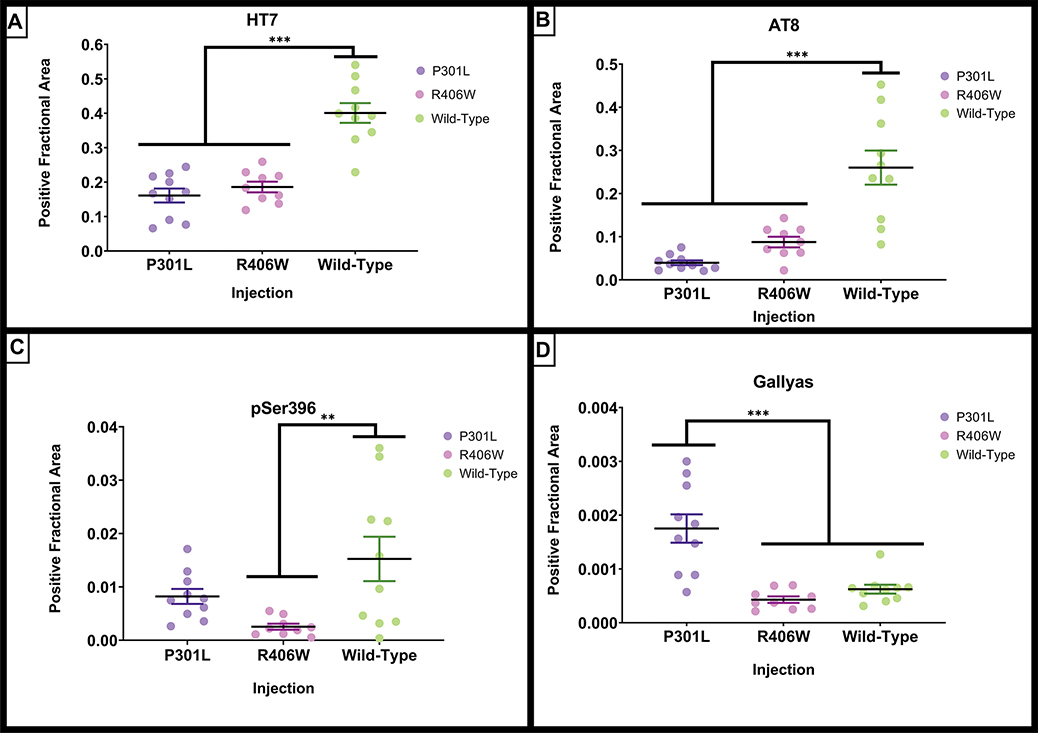
Figure 6.
Quantification of histological tau staining from Figure 5. The amount of staining was quantified per hemisphere due to atrophy of some regions of interest in some conditions. The tauwild-type injected group had the greatest amount of histological total and phosphorylated tau, whereas the tauP301L injected group had the greatest amount of silver positive neurofibrillary tangles. Scatterplots of individual animal’s expression values are plotted by injection and age groups. (A) Quantification of positive fractional area for total tau (HT7) staining. (B) Quantification of positive fractional area for phosphorylated tau Ser199/Thr205 (AT8) staining. (C) Quantification of positive fractional area for phosphorylated tau Ser396 staining. (D) Quantification of positive fractional area for silver positive Gallyas neurofibrillary tau tangle staining. Data are presented as mean ±SEM (error bars). Each dot represents one mouse. **p<0.01, *** p <0.001 Tukey’s post-hoc analyses.

