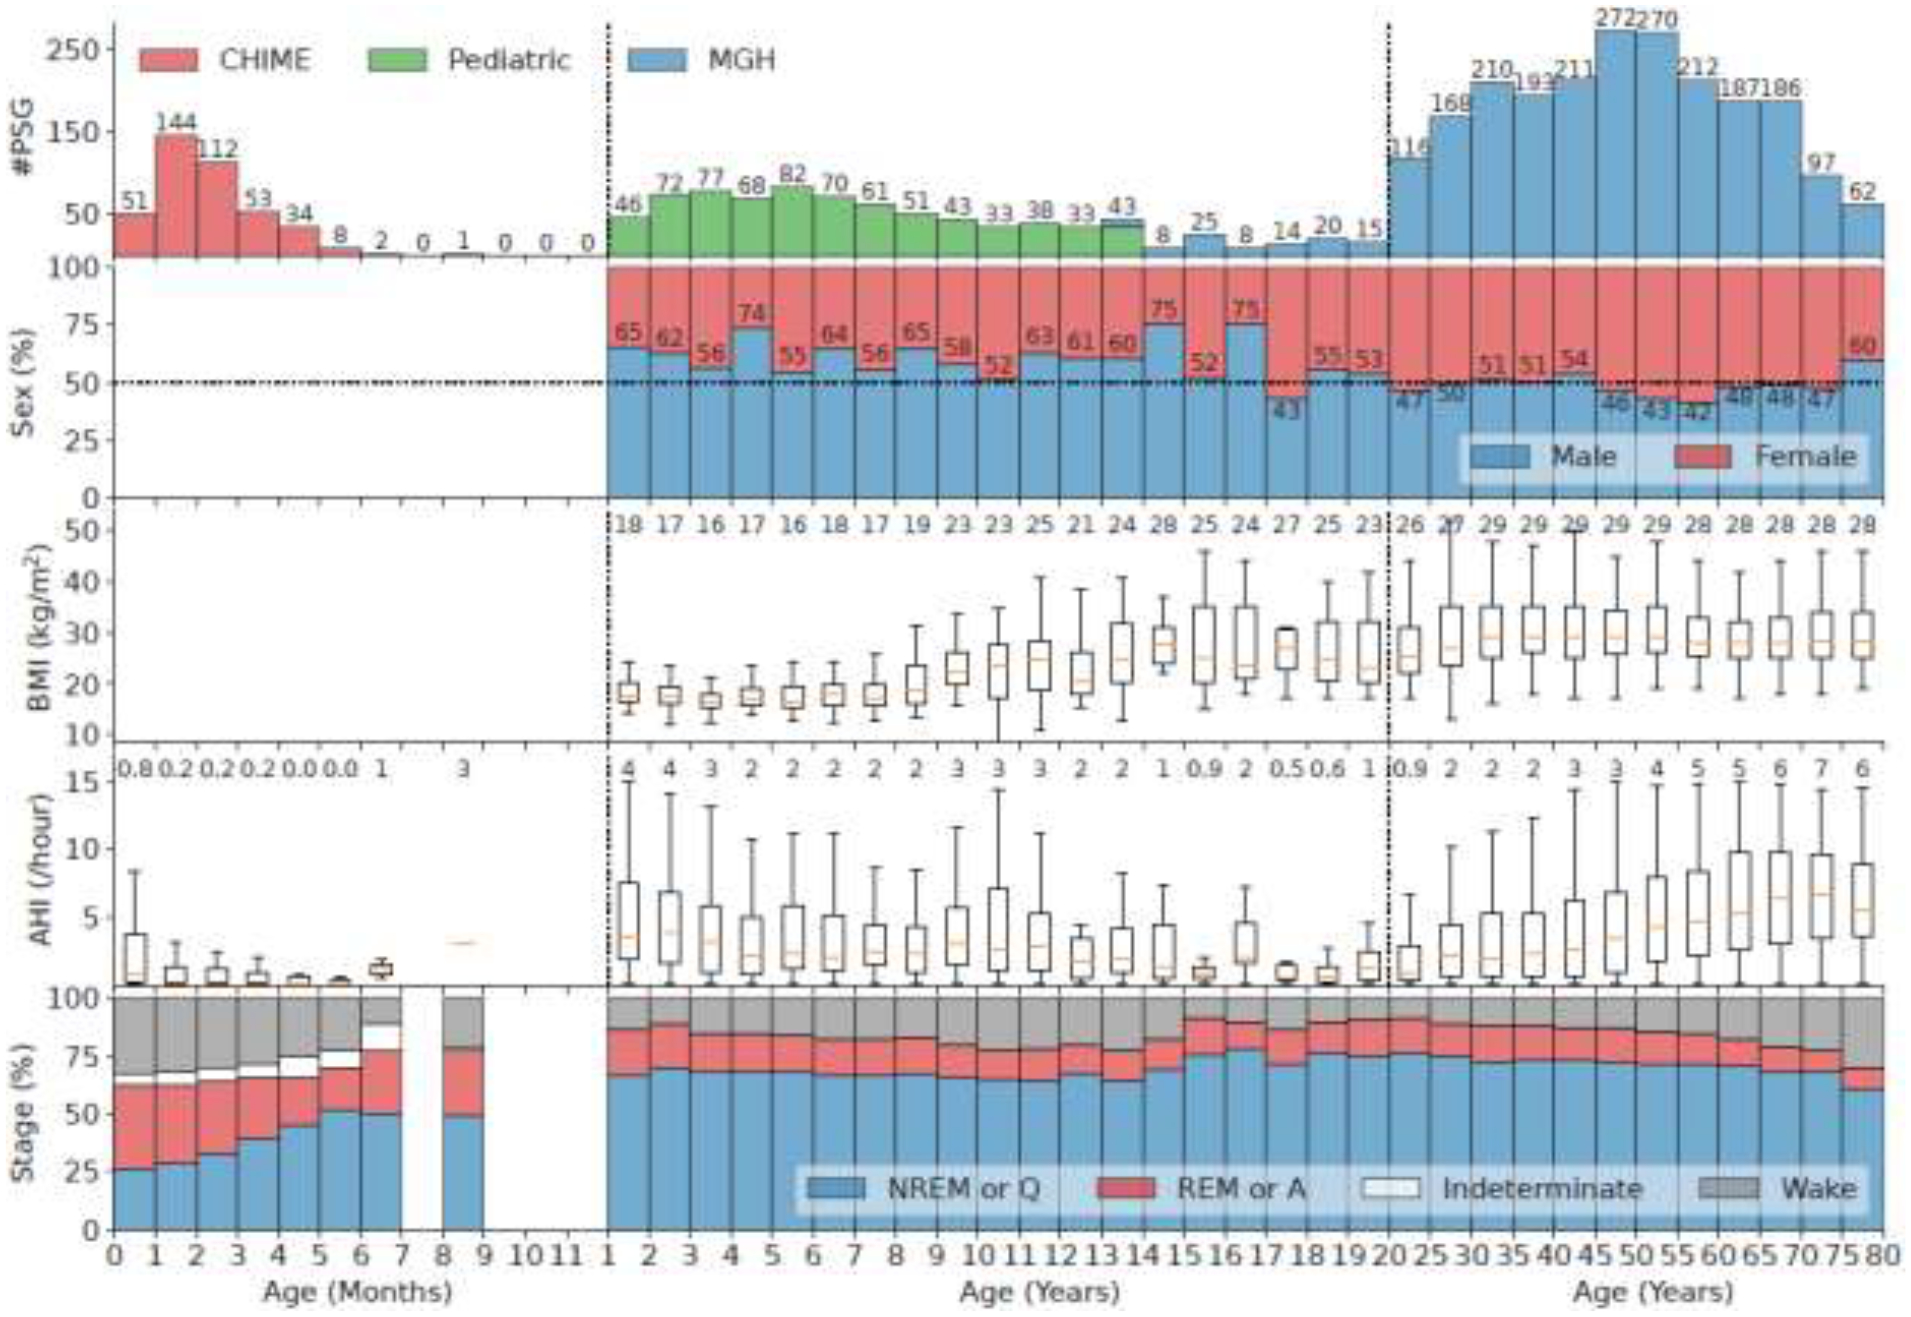
Figure 1.

Characteristics of the combined cohort. The x-axis is age divided into 3 parts: 0 to 11 months (increment 1 month), 1 to 19 years (increment 1 year), and 20 to 80 years (increment 5 years). The two vertical dashed lines in the panels indicate the division. The first panel is the histogram of PSGs in different age bins. Different colors indicate different datasets which are stacked when overlapping age bins exist. The second panel shows the percentage of male and female in each age bin. The third panel shows the boxplots of BMI in each age bin when available. The middle orange line of each box indicates the median, the boundary of the box indicates the 75% and 25% percentiles, and the whiskers extend the box by 1.5 times the inter-quartile range. The numbers at the top show the median values. The fourth panel shows the boxplots of AHI in each age bin. The bottom panel shows the distribution of sleep stages. For the CHIME dataset, the sleep stages are quiet sleep (Q) which resembles NREM, active sleep (A) which resembles REM, indeterminate or transitional (I), and awake (W).
