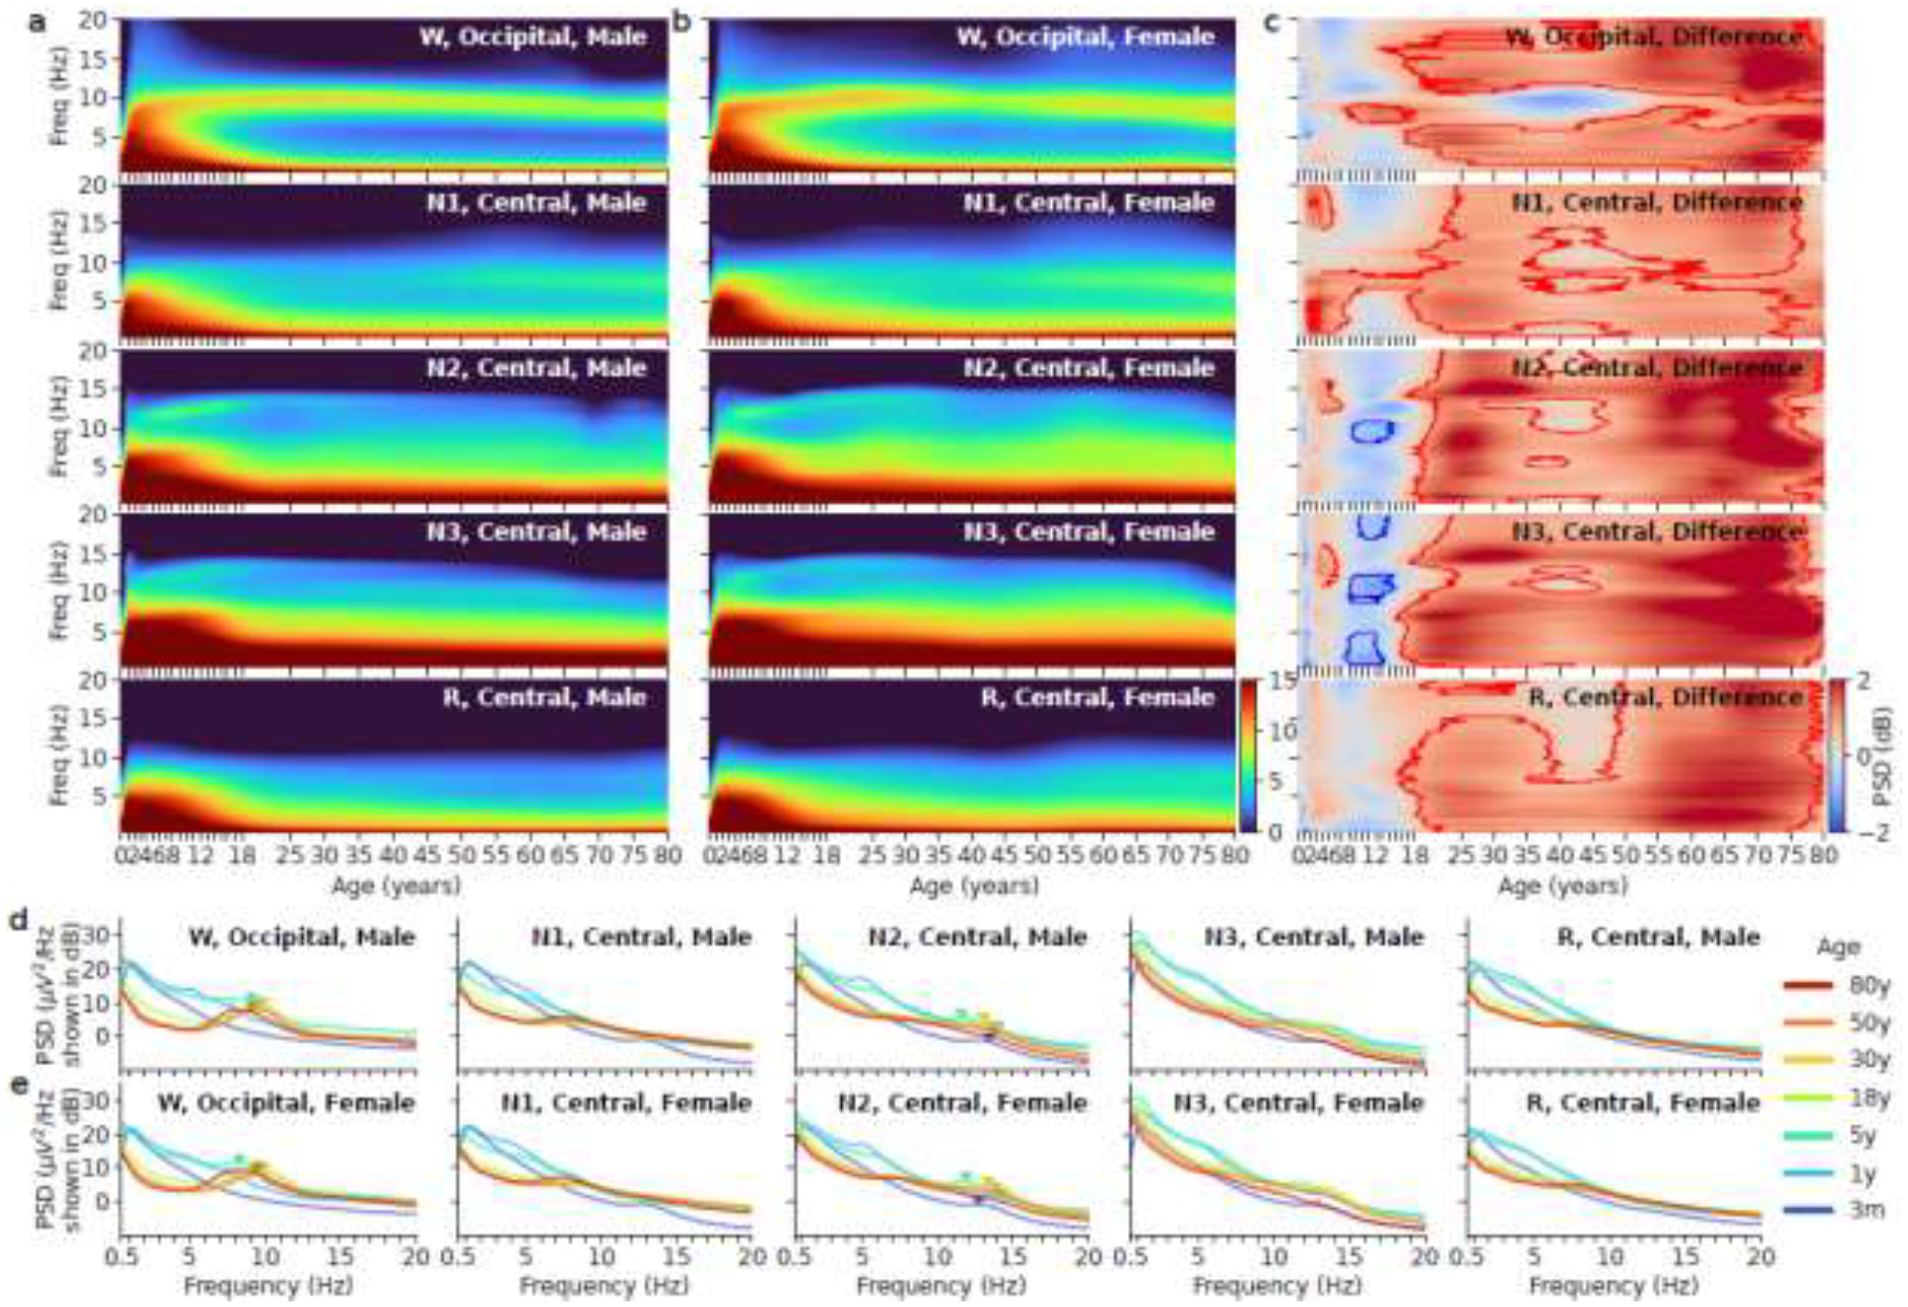
Figure 2.

Left two columns: Age vs. spectrum for all five sleep stages in males (a) vs. females (b). The x-axis is age after birth in years. The y-axis is frequency from 0.5Hz to 20Hz. The power is shown in the unit of decibels. (c) Difference between males and females in the Pediatric dataset and MGH dataset. Red means females have higher mean power; blue means males have higher mean power. The contours outline regions within which sex differences are statistically significant. (d) Example spectra at 3 months, 1, 5, 18, 30, 50, and 80 years of age in males and the five sleep stages. The triangle markers indicate alpha peak frequency in W and sigma peak frequency in N2. (e) Example spectra at 3 months, 1, 5, 18, 30, 50, and 80 years of age in females and the five sleep stages.
