
Figure 3.
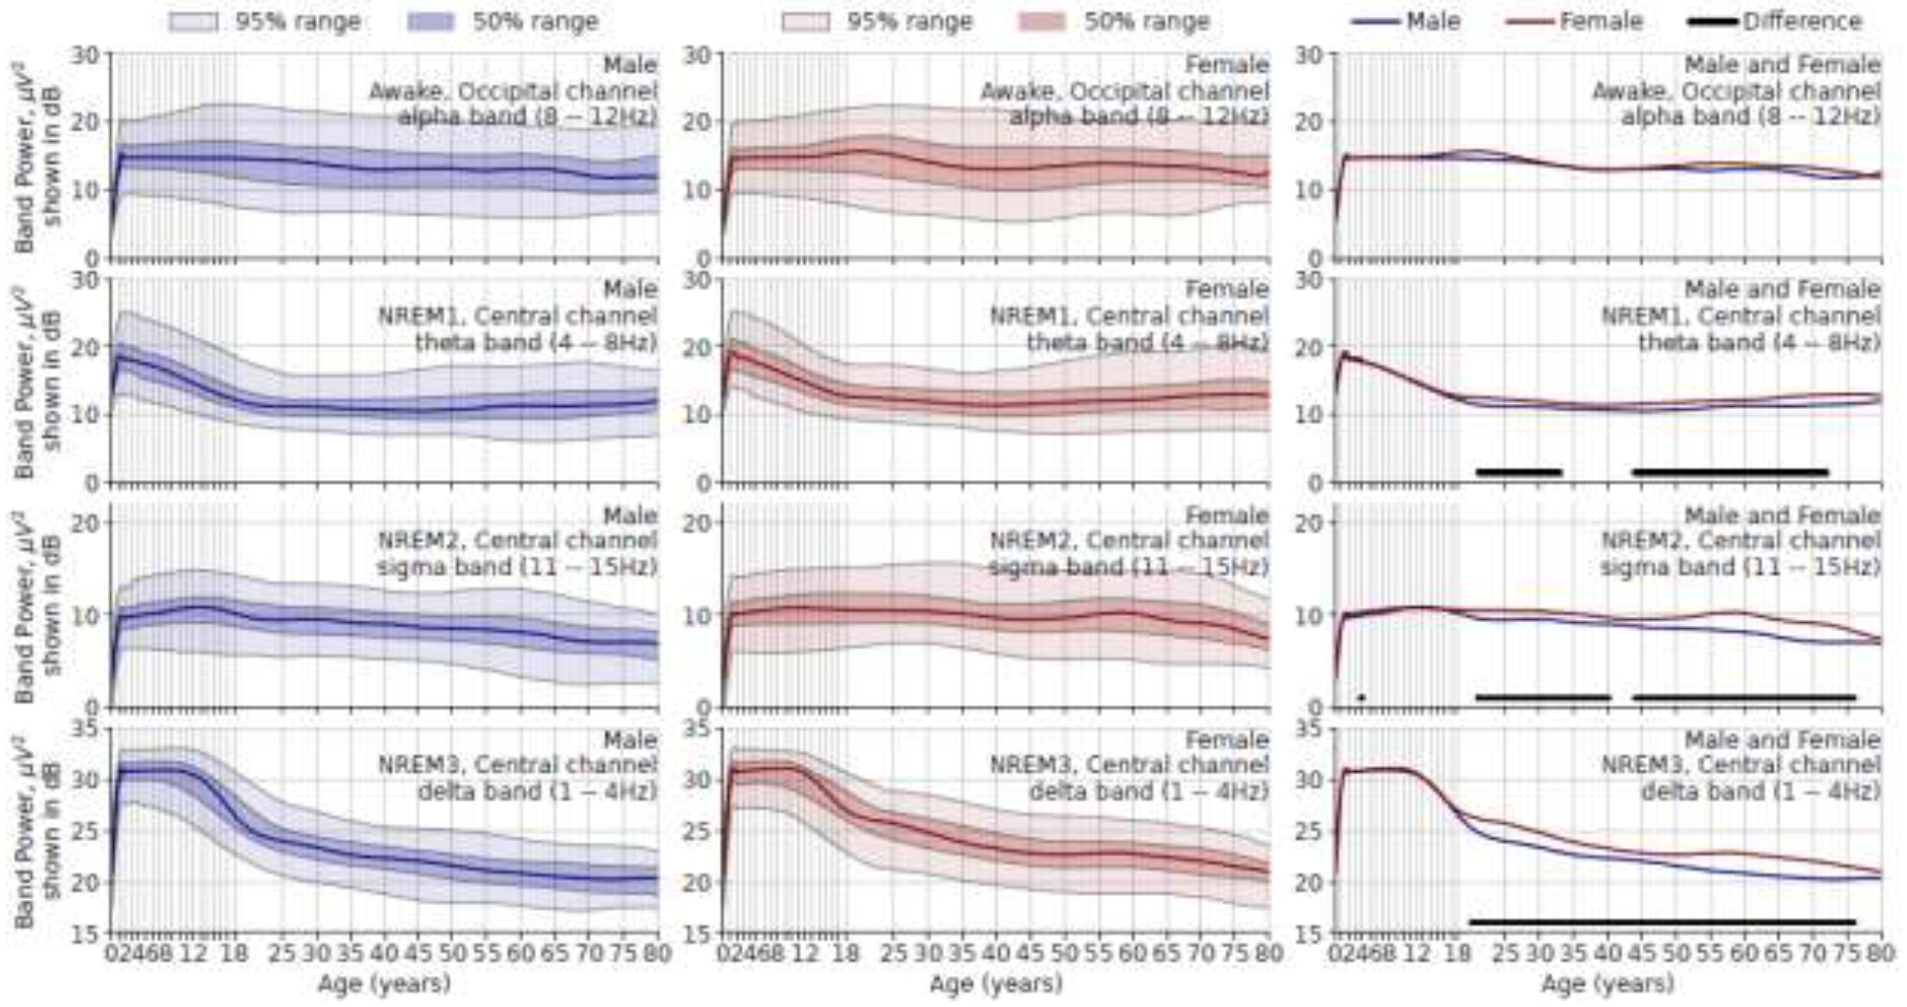
Age vs. absolute band power in μV2 (but shown in decibels). Rows show different frequency bands in different sleep stages. Left column, males; middle column, females; right column, both sexes. The ranges are derived from population data. In the right column, the solid lines beneath the red and blue curves indicate age ranges where median values for males and females are significantly different after Holm-Bonferroni correction.