
Figure 5.
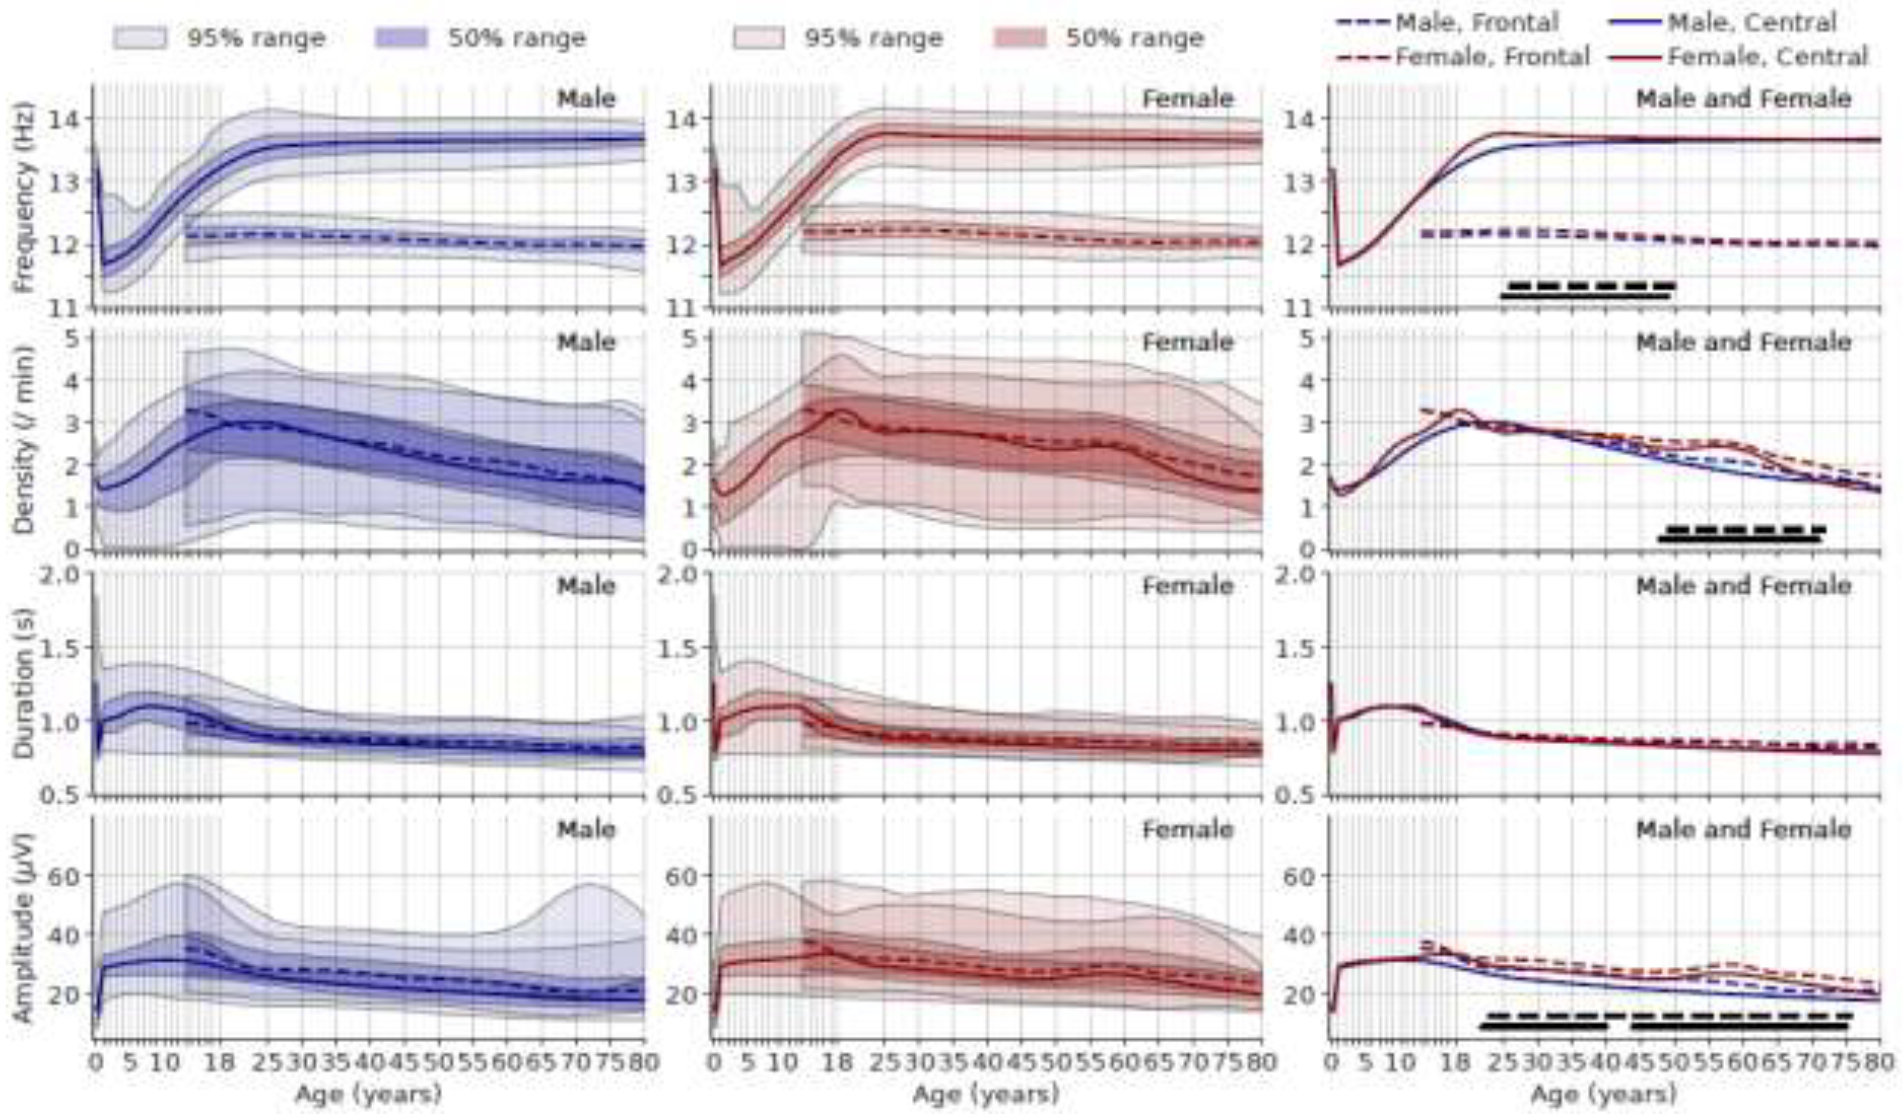
Age vs. spindle frequency (1st row), density (2nd row), duration (3rd row), and amplitude (4th row). Left column: males; middle column females; right column: both sexes combined. The solid lines represent spindle parameters from the average of C3-M2 and C4-M1 (central channels). The dashed lines represent spindle parameters from the average of F3-M2 and F4-M1 (frontal channels). In the right column, the lines at the bottom (dashed for frontal channel, solid for central channel) indicate age range where the median value of males and females are significantly different after Holm-Bonferroni correction.