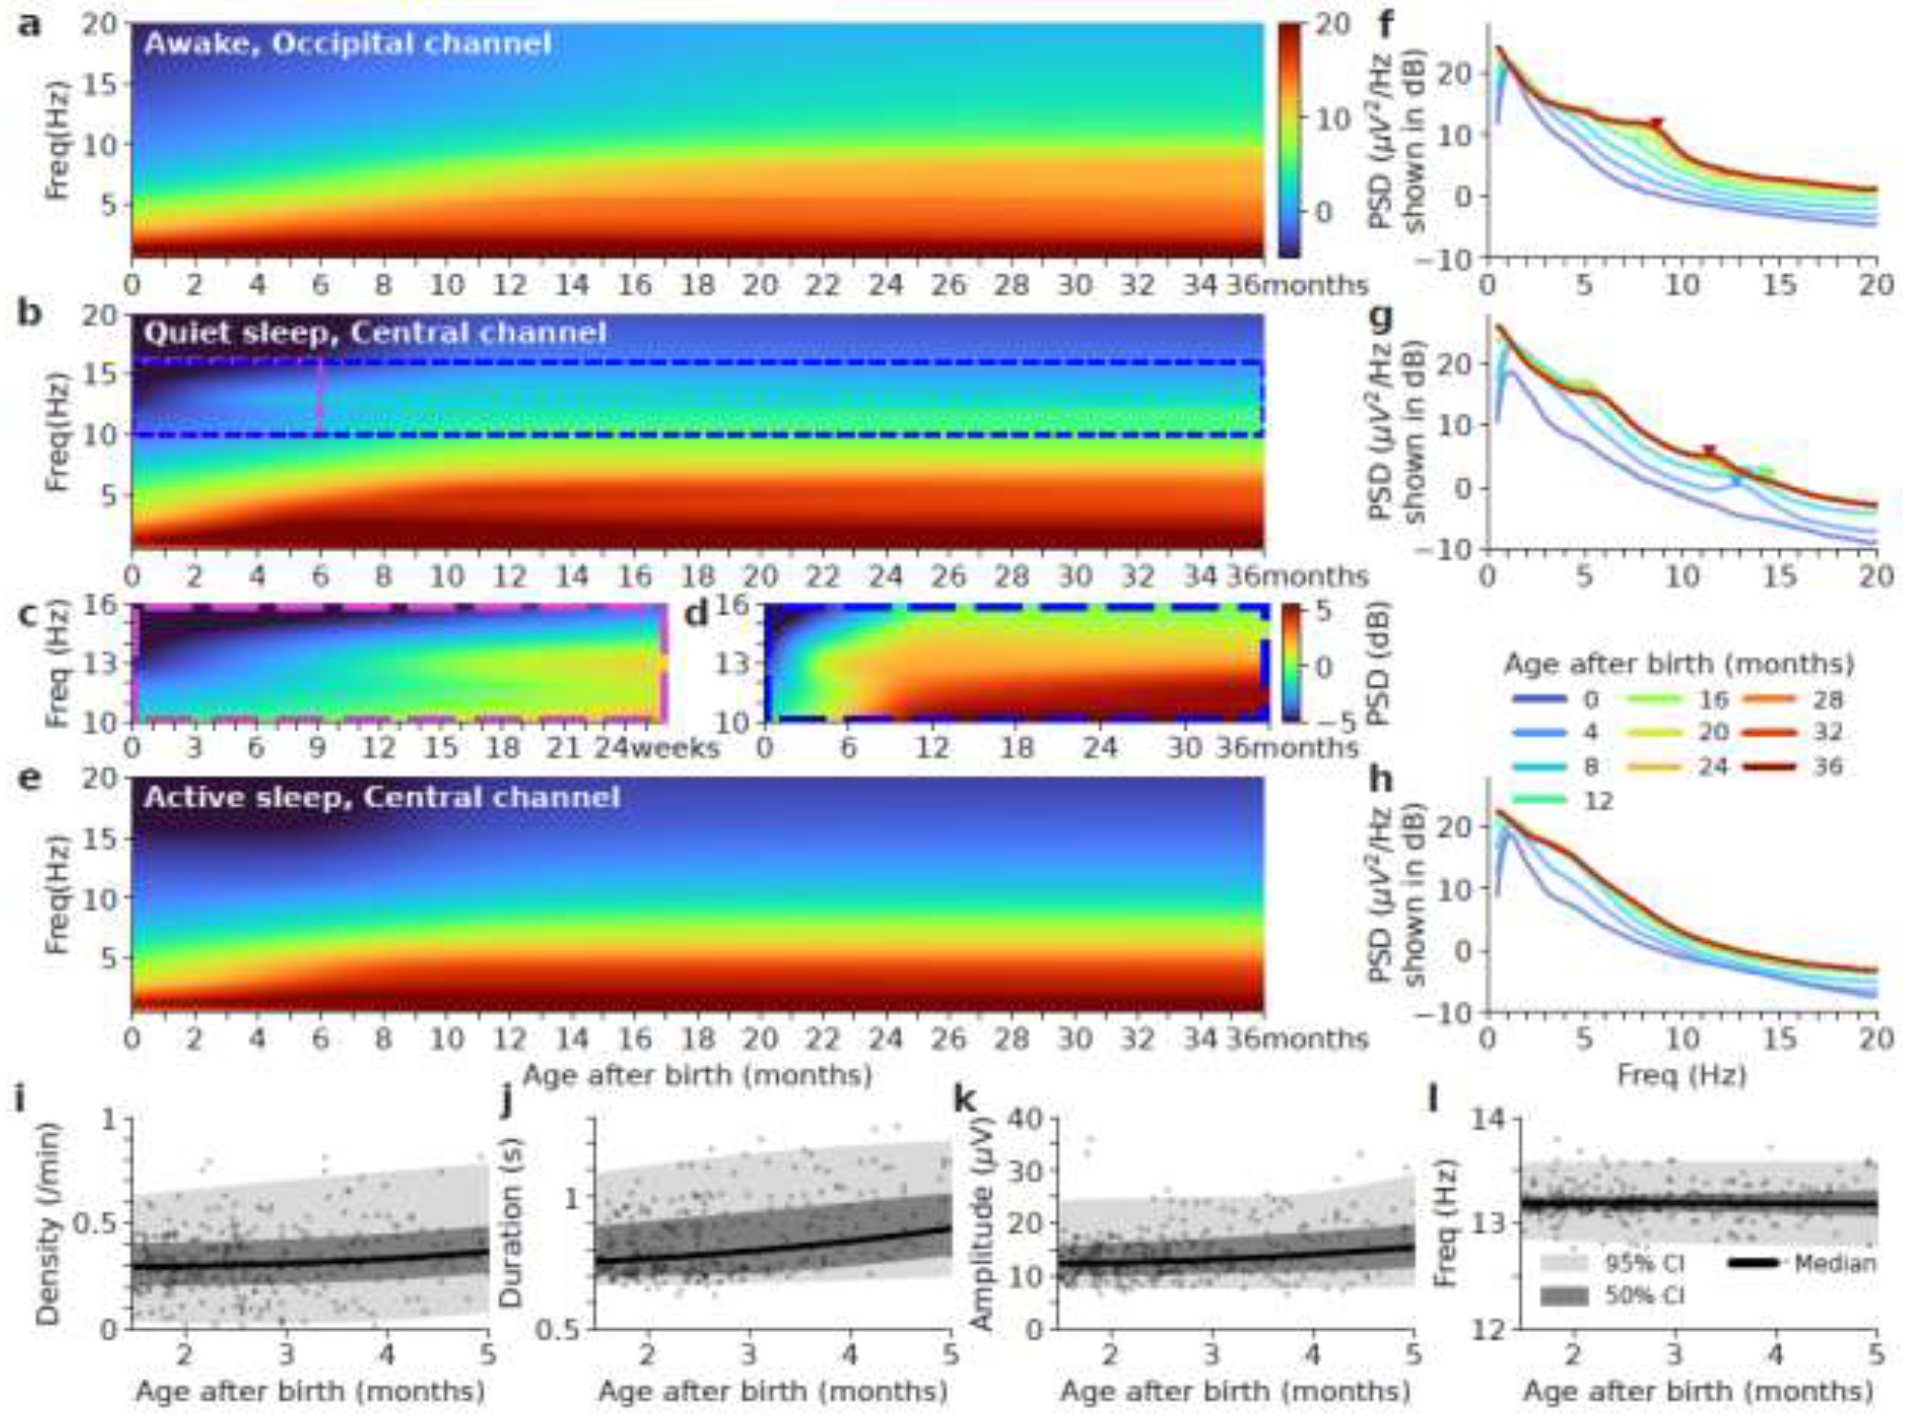
Figure 6.

Age-related spectra for wake (a), quiet sleep (Q or NREM) (b), and active sleep (A or REM) (e) in the first 3 years of life. Panel c and d we show zooms of areas of white and blue regions respectively with a different color range to highlight the subtle spectral changes. (f, g, h) The averaged spectra for each 3-month bin for each sleep stage respectively. The x-axis is frequency in Hz. The y-axis is power spectral density (PSD) in decibels (dB). The triangle markers indicate alpha peak frequency in wake and sigma peak frequency in quiet sleep. (i, j, k, l) Age vs. spindle density, duration, amplitude, and frequency during quiet sleep in the central channel for the first 5 months of life. Spindles parameters are obtained from the average of C3-M2 and C4-M1 (central channels). Pearson’s correlation p-values are significant for density, duration, amplitude, except for frequency.
