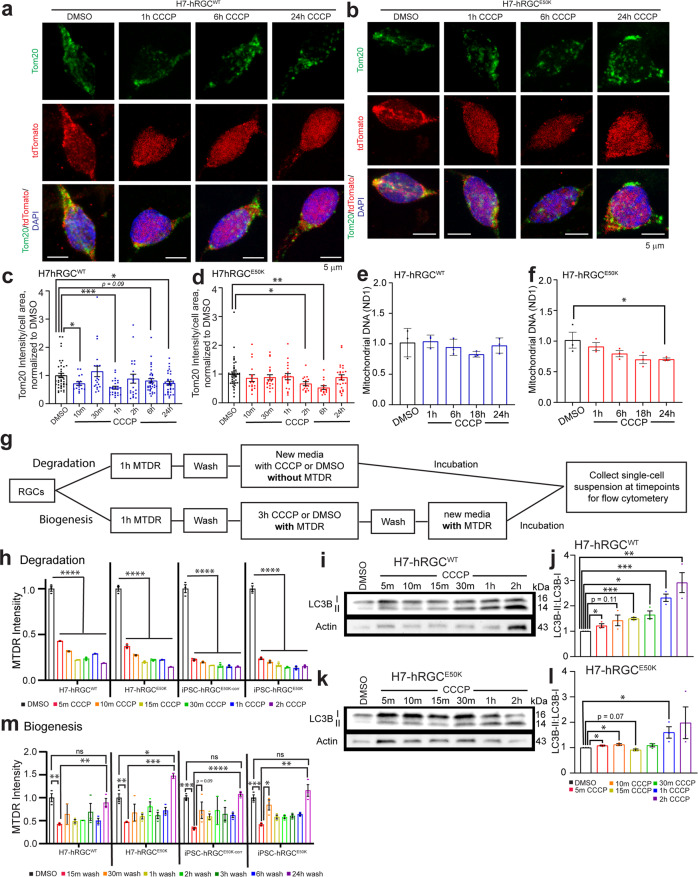
Fig. 1. hRGCs maintain mitochondrial mass by simultaneous degradation and biogenesis of mitochondria under damage.
a, b Representative confocal immunofluorescence images of H7-hRGCs against mitochondrial Tom20, tdTomato, and DAPI after indicated 10 μM CCCP treatment timepoints. Scale bars are 5 μm. c, d Quantification of Tom20 intensity per cell area from sum projections of confocal z-stacks, normalized to corresponding DMSO. n = 14–42 cells per condition. e, f Mitochondrial DNA copy number analyzed by qPCR for mitochondrial ND1 gene relative to nuclear RNase P. Results shown as ΔΔCt fold changes relative to DMSO control for different times points of 10 μM CCCP treatment. n = 3, 3 technical repeats averaged for each biological repeat. g Schematic of MTDR flow experiments for tracking degrading versus newly synthesized mitochondria. h Mitochondrial mass in single cells at different CCCP (10 μM) treatment time points for degradation or m different timepoints post CCCP (10 μM) wash for biogenesis were measured by flow cytometer, and the average fluorescence intensity normalized to DMSO was plotted. n = 3. i, k Representative western blot images of LC3B and actin from i hRGCWT and k hRGCE50K treated with CCCP (10 μM) for the indicated timepoints. j, l Quantification of the ratio of LC3B-II to corresponding LC3B-I for each condition. n = 3. ٭p-value < 0.05, ٭٭p-value < 0.01, ٭٭٭p-value < 0.001, ٭٭٭٭p-value < 0.0001. Unpaired student’s t-test between independent datasets. Error bars are SEM.

