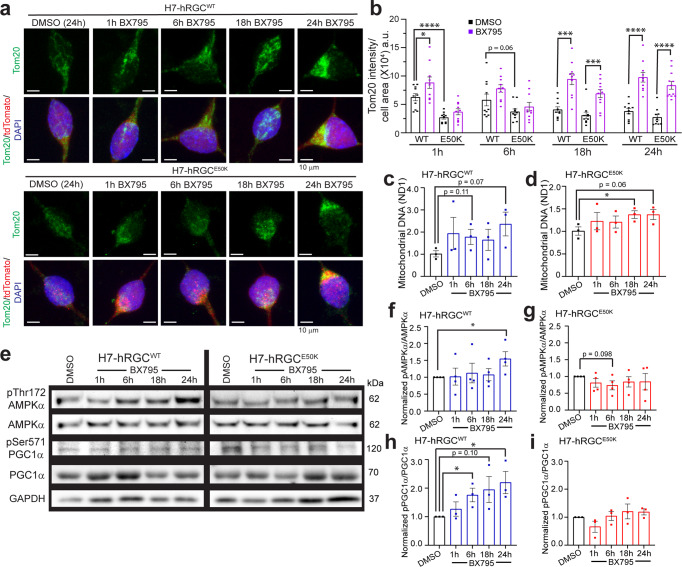
Fig. 4. TBK1 inhibition activates mitochondrial biogenesis in hRGCs.
a Representative confocal immunofluorescence images of mitochondria (Tom20), tdTomato, and DAPI after 1 μg/ml BX795 or equivalent DMSO treatment for the indicated time. Scale bars are 10 μm. b Quantification of Tom20 intensity per cell area from the sum projections of confocal z-stacks. n = 10 cells per condition. c, d Mitochondrial DNA copy number analyzed by qPCR for mitochondrial ND1 gene normalized to nuclear RNase P gene. Results shown as ΔΔCt fold change normalized to DMSO control for different times points of 1 μg/ml BX795 treatment. n = 3, 3 technical repeats averaged for each biological repeat. e Representative western blot images of H7-hRGCs treated with 1 μg/ml BX795 for indicated timepoints. f–i For each protein, band intensities were quantified and first normalized to corresponding GAPDH loading control, then to its DMSO values, f, g ratio between p-AMPKαThr172 to AMPKα, and h, i ratio between p-PGC1αSer571 to PGC1α. n = 3-4. ٭p-value < 0.05, ٭٭p-value < 0.01, ٭٭٭p-value < 0.001, ٭٭٭٭p-value < 0.0001. Unpaired student’s t-test between DMSO and the individual BX timepoints. Error bars are SEM.

