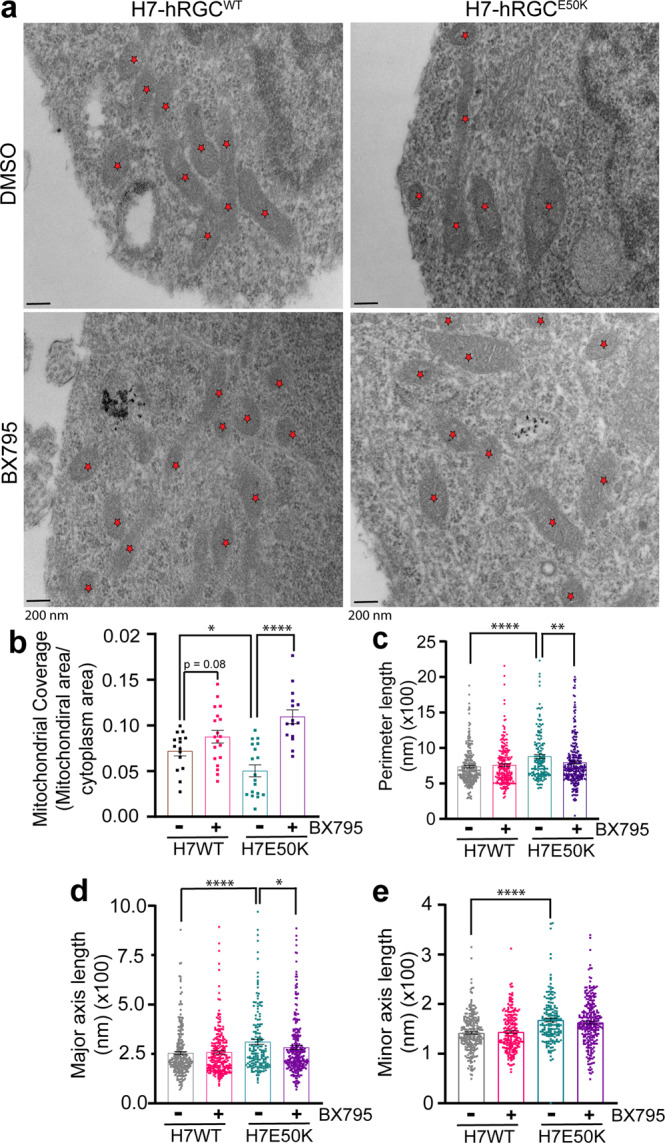
Fig. 5. TBK1 inhibition improves mitochondrial coverage and mitigates swelling in E50K hRGCs.

a TEM images of H7-hRGCWT and H7-hRGCE50K after 24 h DMSO or BX795 (1 μg/ml) treatment, at 49000X magnification. Asterisks represent mitochondria. Scale bar = 200 nm. Quantification of b mitochondrial coverage (mitochondrial area/cytoplasm area) for each image, c perimeter length, d major axis length, and e minor axis length for each mitochondrion. b Unpaired student’s t-test or c–e Mann–Whitney U test between independent datasets, ٭p-value < 0.05, ٭٭p-value < 0.01, ٭٭٭٭p-value < 0.0001, n = 15–24. Error bars are SEM.
