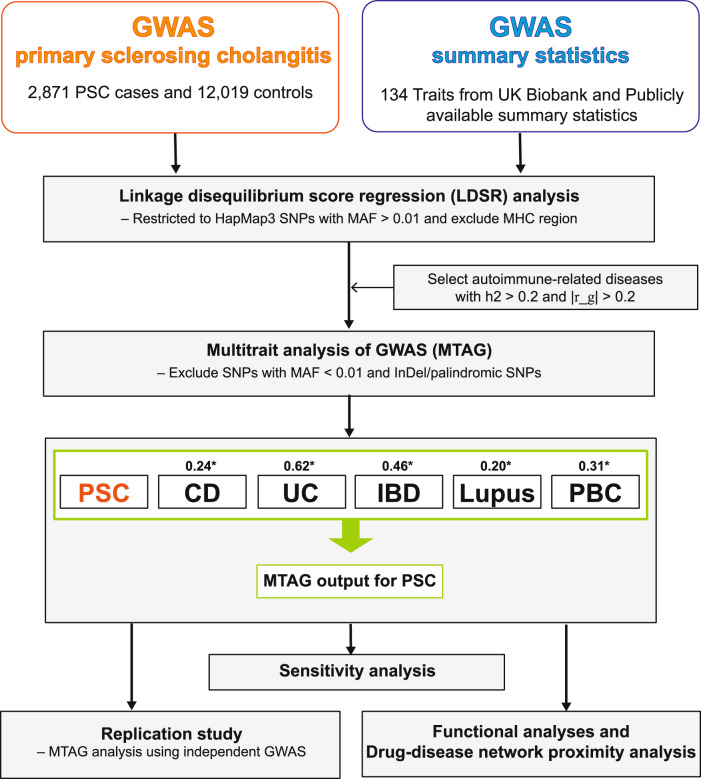
Fig. 1. Flow chart of the analytical workflow in this study.
h2 represents SNP-based heritability in the observed scale. |r_g| represents the absolute value of the pairwise genetic correlation between PSC and the traits studied. MAF stands for a minor allele frequency. MHC region stands for the major histocompatibility complex region. The asterisk “*” indicates the genetic correlation between PSC and each tested trait. The imputed summary statistics for PBC were used for subsequent analyses.

