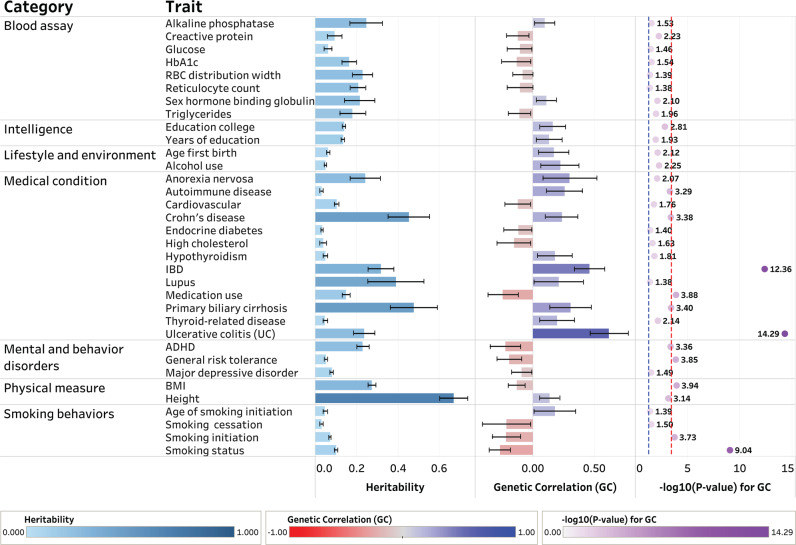
Fig. 2. The shared heritability and genetic correlation of PSC among clinical and epidemiological traits.
The dotted lines in blue and red indicate nominally and Bonferroni-corrected significant levels of and , respectively. The error bar represents 95% confidence interval for the estimate of SNP-based heritability and pairwise genetic correlation of PSC in each trait, respectively. Sample sizes used to derive the estimates of SNP-based heritability and pairwise genetic correlation of PSC in each trait are shown in Supplementary Data 1. The dashboard for visualizing the results from LDSR was created using Tableau Desktop software (version 2022.2).

