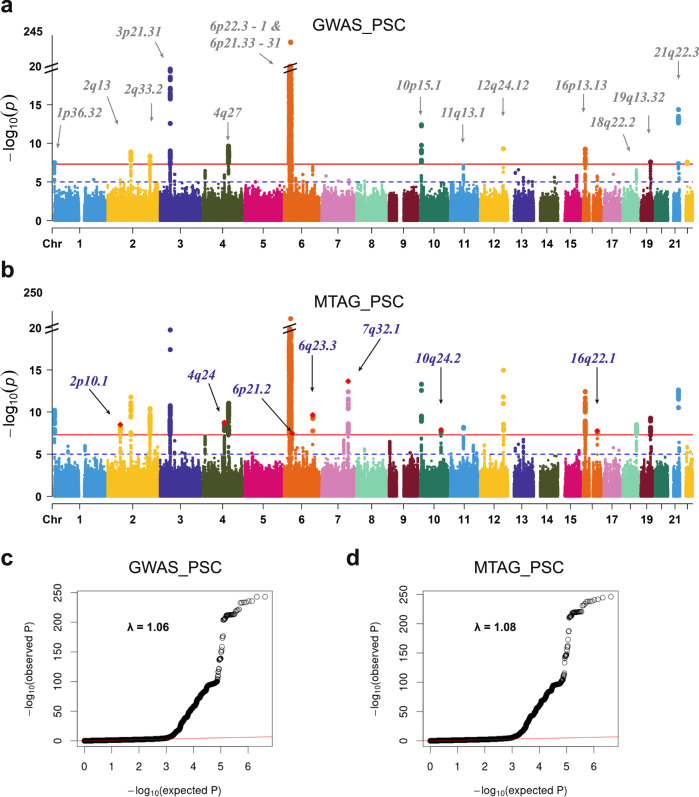
Fig. 3. Manhattan plots and quantile-quantile plots for the single-trait GWAS and the multitrait GWAS of PSC.
a, c PSC single-trait GWAS (Ji et al., 2017, PMID:27992413; GWAS_PSC). b, d MTAG-identified PSC-specific GWAS against five immune-mediated disorders, CD, UC, IBD, lupus, and PBC (MTAG_PSC). The x-axis represents chromosomal location, and the y-axis represents the −log10(P-value). The cytoband annotations for the newly and previously identified loci are in purple (b) and gray (a), respectively. The solid lines in red and the dotted lines in blue indicate the genome-wide significant two-sided unadjusted P-value of and the suggestive significant two-sided unadjusted P-value of , respectively. P-values are derived using multitrait analysis of GWAS in the discovery study.

