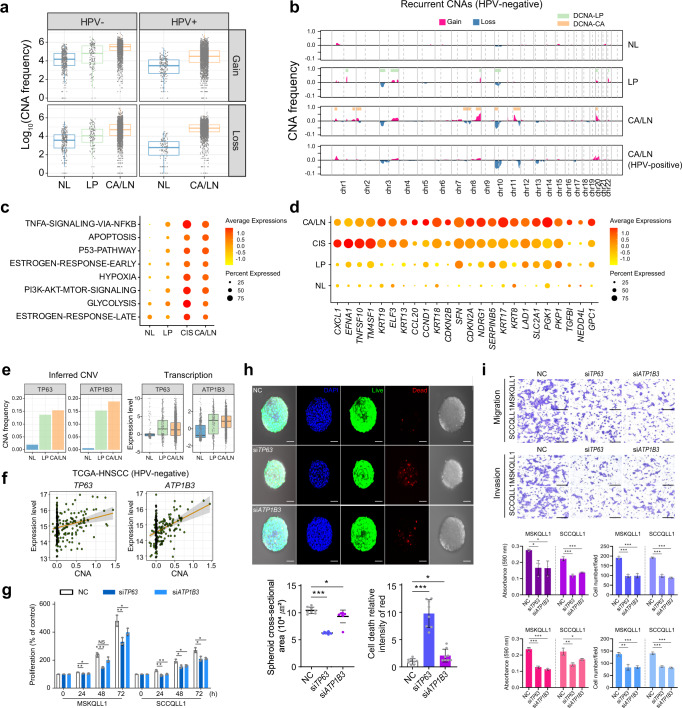
Fig. 2. DNA copy number-dependent deregulation of TP63 and ATP1B3 promotes HNSCC progression.
a For each tissue type, log-scaled frequencies of the CNA gains (top) and losses (bottom) in the HPV-negative and HPV-positive samples are shown. b CNA frequencies are shown in chromosomal order for each HPV-negative tissue type. c, d Dot plots show the differential expression of the Hallmark gene sets (c) and genes (d) in the epithelial cells across the tissue types of NL, LP, CIS, and CA/LN tissues. e Frequencies of the CNAs (left) and the expression levels (right) of TP63 and ATP1B3 genes in HPV-negative patients are shown. f DNA copy number-correlated transcriptional expression of TP63 and ATP1B3 are shown in the HPV-negative TCGA-HNSCC patients (n = 240). g The MSKQLL1 and SCCQLL1 cells are treated with the non-target control (NC), siTP63, or siATP1B3, and their viabilities are shown at indicated times. h FaDu cells are transfected with NC, siTP63, or siATP1B3 and cultured in spheroids using hanging drop plates, and the cell viability is shown (top). The cross-section area of FaDu cells (bottom left) and the numbers of dead cells (bottom right) with the treatment of NC, siTP63, or siATP1B3, are shown. n = 8 biologically independent experiments. Scale bar, 50 μm. i MSKQLL1 and SCCQLL1 cells are transfected with NC, siTP63, or siATP1B3, and their cell proliferation, migration, and invasion are shown. n = 3 biologically independent experiments. Scale bar, 100 μm. In g–i data are shown as mean ± SD. *,P < 0.05; **,P < 0.01; ***,P < 0.001; ns, nonsignificant by the Student two-tailed unpaired t-test. In a, e, box plots show median (center line), the upper and lower quantiles (box), and the range of the data (whiskers). Source data are provided in a Source Data file.

