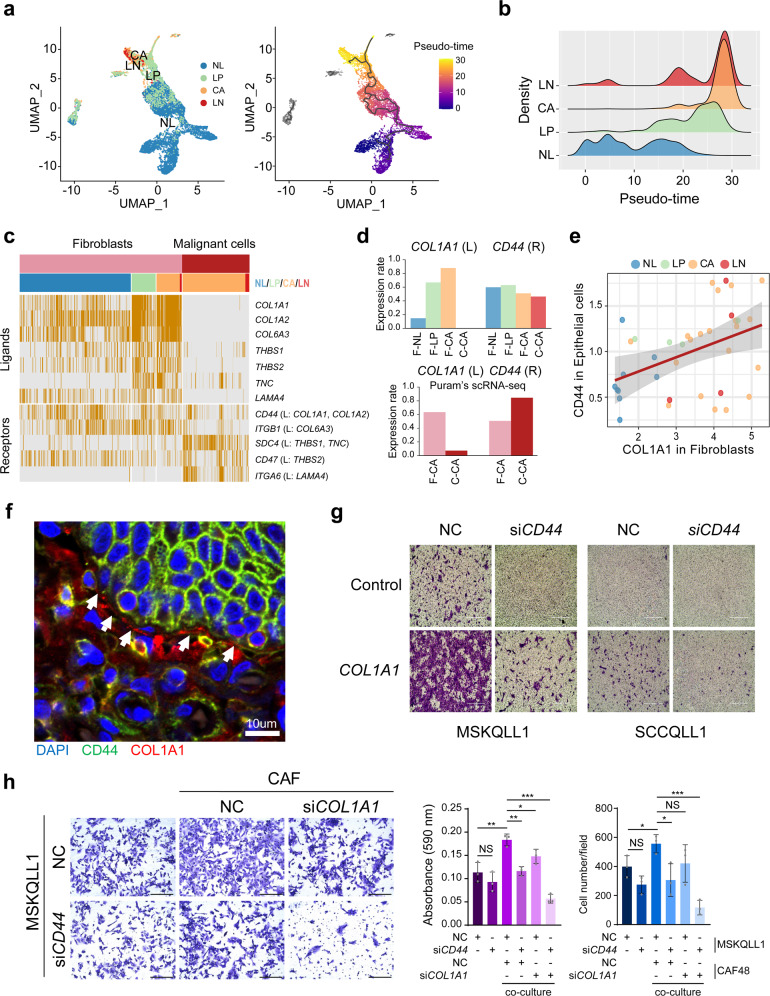
Fig. 4. Fibroblasts-derived COL1A1 expression interacts with CD44 in malignant cells.
a Tissue types of NL, LP, CA, and LN (left) and the pseudo-times (right) of the cells are shown in UMAP plots. b Distributions of the pseudo-time in the fibroblasts across the tissue types are shown. c A heatmap shows the interdependent expression of the ligand-receptor pairs with stepwise expression during HNSCC progression between fibroblasts and malignant cells. d The cell proportions for expressed cells of COL1A1 and CD44 are shown in fibroblasts (F-) and malignant cells (C-) across the tissue types (e.g., F-NL, fibroblasts in NL; C-NL, malignant cells in NL) from our data (top) and that of GSE103322 (bottom). e The correlation plot shows COL1A1 expression levels in fibroblasts and CD44 expression levels in epithelial cells in HNSCC patients. The gray shading represents 95% confidence interval (CI). f An immunohistochemical image shows the expression of collagen and CD44 in fibroblasts (red) and neighbored malignant cells (green), respectively. n = 3. g Invasion of the MSKQLL1 and SCCQLL1 cells treated with siRNAs targeting CD44 (siCD44) or non-target control (NC) in the presence or absence of collagen (1 µg/mL). n = 3. Scale bar, 400 µm. h MSKQLL1 cells and CAF cells are co-cultured with the treatment of NC, siCD44, or siCOL1A1, and the images of the migrated cells (left) and the measured cell population (right) are shown. n = 3 biologically independent experiments. Scale bar, 100 μm. Data are shown as mean ± SD. *,P < 0.05; **,P < 0.01; ***,P < 0.001; ns, nonsignificant by the Student two-tailed unpaired t-test. Source data are provided in a Source Data file.

