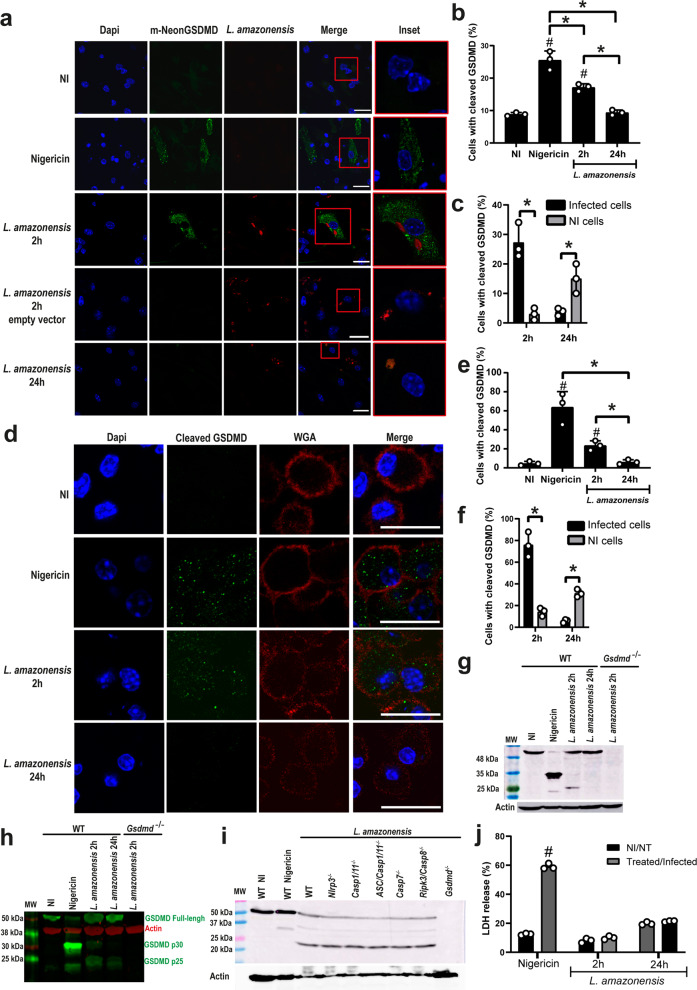
Fig. 1. Leishmania induces a noncanonical GSDMD cleavage in macrophages.
a–c BMDMs from Gsdmd–/– mice were transduced with a lentivirus encoding GSDMD-mNeon. a Representative images of BMDMs expressing GSDMD-mNeon, pretreated for 4 h with LPS (100 ng/mL) and infected with L. amazonensis-RFP (red); MOI 3. The cell nucleus was marked with Dapi (blue). Cleaved GSDMD (N-terminal) in green. Scale bar 20 µm. b Percentage of transduced BMDMs containing cleaved GSDMD after 4 and 24 h infection with L. amazonensis. Nigericin was used as a positive control. c Percentage of infected versus non-infected BMDMs containing cleaved GSDMD (N-terminal). A total of 100 cells in each triplicate well were analyzed. d–f BMDMs from C57BL/6 mice were pretreated for 4 h with LPS (100 ng/mL) and infected with an MOI 5. d Representative images of BMDMs stained with anti-C-terminal GSDMD showing cleavage of endogenous GSDMD (green). Plasma membrane was marked with WGA (red). Scale bar 20 µm. e Percentage of BMDMs with endogenous GSDMD cleavage (C-terminal) after 2 and 24 hs infection. f Percentage of infected and non-infected BMDMs with endogenous GSDMD cleavage (C-terminal). A total of 100 cells in each triplicate well were analyzed. g–h Lysates from C57BL/6 and Gsdmd–/– BMDMs pretreated for 4h with LPS (100 ng/mL) and infected for 2 or 24 h were assessed for GSDMD cleavage by western blot. Show are the same experiment stained with conventional chemiluminescence (g) or near-infrared fluorescence (h). i Lysates from WT, Nlrp3–/–, Casp1/11–/–, Asc/Casp1/11–/–, Casp7–/–, Ripk3/Casp8–/–, and Gsdmd–/– BMDMs pretreated for 4 h with LPS (100 ng/mL) and infected for 2 h were assessed for GSDMD cleavage by western blot. MW, Molecular Weight. j LDH release was assessed 2 h and 24 h after infection or 2 h after treatment with Nigericin. NI non-infected, NT non-treated. Data are presented as mean values ±SD of triplicate wells. #P < 0.05 compared with NI/NT cells; *P < 0.05 comparing the indicated groups, as determined by two-way ANOVA. Shown is one representative experiment of five independent experiments performed. Source data are provided as a Source Data file.

