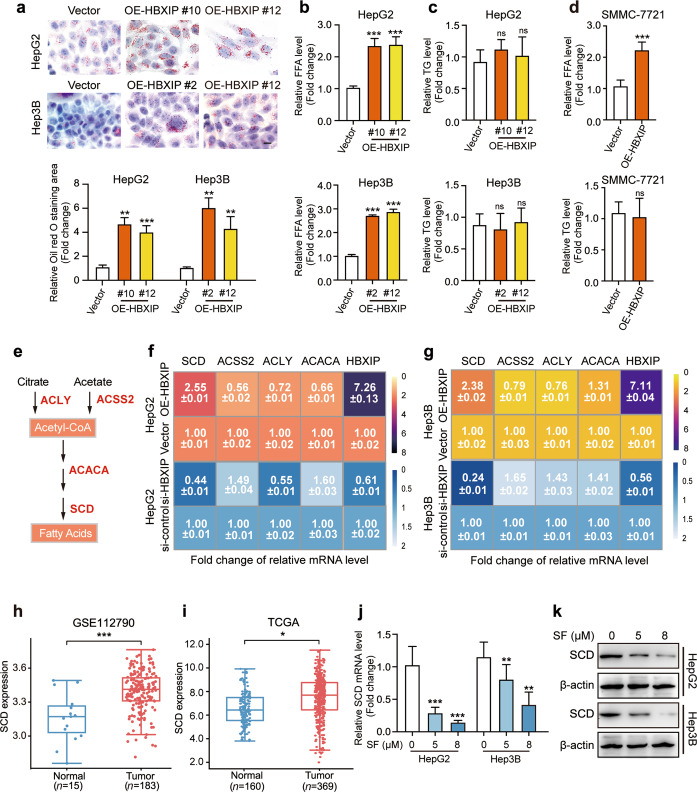
Fig. 3. SCD is the downstream effector of HBXIP in sorafenib-treated HCC cells.
a Oil red O staining of the indicated stable cells (HepG2-Vector, HepG2-OE-HBXIP #10 #12, Hep3B-Vector, Hep3B-OE-HBXIP #2 #12). Scale bar, 20 μm. b, c Free fatty acids and TG were detected in HepG2, Hep3B cells and two HBXIP stable expression clones. d Free fatty acids and TG were detected in SMMC-7721 cells transfected with pcDNA-Vector or pcDNA-HBXIP for 48 h. e Schematic diagram of several fatty acids key enzymes. f, g The average of three times fold changes ± SD in mRNA levels of HBXIP determined by RT-qPCR assays in HepG2 or Hep3B cells transfected with pcDNA-Vector and pcDNA-HBXIP or si-control and si-HBXIP. h SCD expression level in 183 HCC patients’ tumor tissues and 15 normal tissues from GSE112790. i SCD expression level in 369 HCC patients’ tumor tissues and 160 normal tissues from TCGA dataset. j Fold change in mRNA levels of SCD determined by RT-qPCR assays in the indicated cells dose-dependently treated with sorafenib for 48 h. k WB analysis was used to analyze the expression of SCD in HepG2 cells or Hep3B cells dose-dependently treated with sorafenib for 48 h. Columns with error bars symbolize the average of three independent replicates ± SD. Three experiments with consistent results tendency were analyzed by two-tailed Student’s t test (a–d) or one-way ANOVA (j). ***P < 0.001, **P < 0.01, *P < 0.05, ns not significant.

