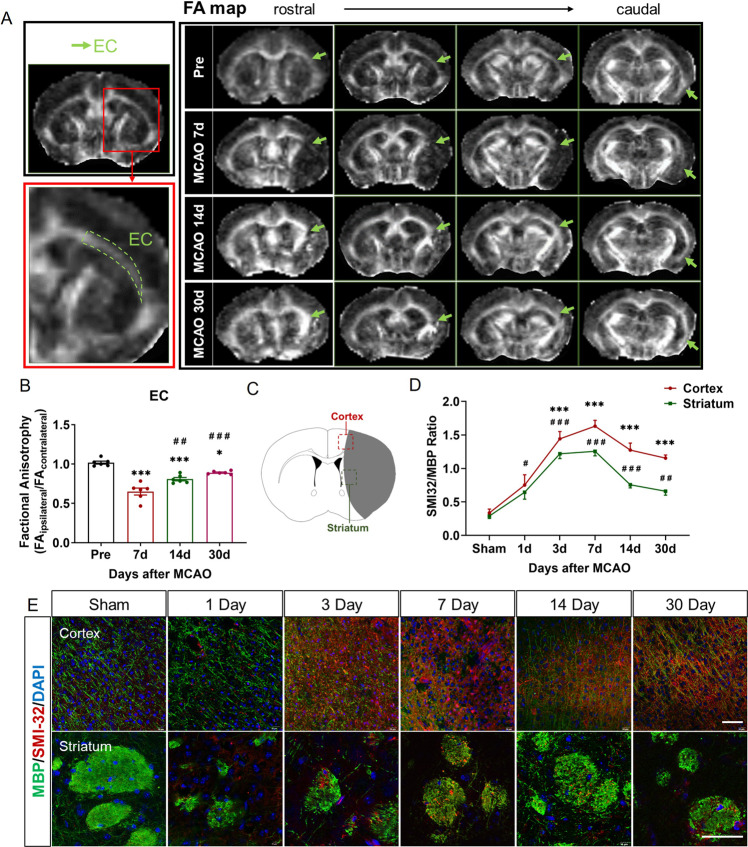
Fig. 1. White matter injury recovered gradually from Day 7 after tMCAO.
A Representative DTI axial views of the same mouse brain pre-tMCAO and on the 7, 14, and 30 Day post-tMCAO. Green arrowheads pointed EC. B Quantification of FA value expressed as the ratio of ipsilateral values to the contralateral values. n = 6. *p < 0.05 and ***p < 0.001 versus Pre-tMCAO group, ##p < 0.01 and ###p < 0.001 versus tMCAO 7 Day group. C Schematic diagram of the observation position on the cortex and the striatum of brain slices after tMCAO or sham operation. D The ratios of SMI32 to MBP staining intensity in the ipsilateral cortex and striatum chronologically. n = 6. ***p < 0.001 compared to sham group in the cortex, #p < 0.05, ##p < 0.01, and ###p < 0.001 compared to sham group in the striatum. E Immunofluorescence staining of SMI32 (red) and MBP (green) in the cortex and the striatum area of sham or 1st, 3rd, 7th, 14th, 30th Day after tMCAO. Scale bars, 20 μm. For all error bars (B, D), mean values ± SEM.

