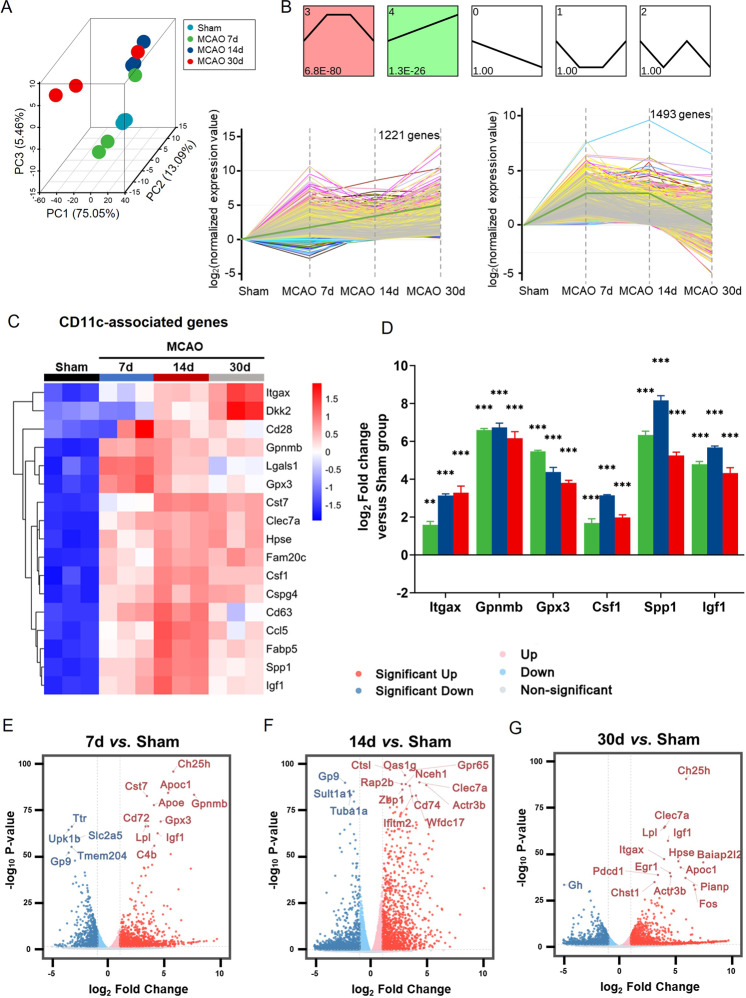
Fig. 3. Microglia in the repairing phase of stroke exhibited molecular signatures associated with CD11c population.
A 3D Principal Component Analysis (PCA) of the 12 samples in Sham, tMCAO 7 Day, tMCAO 14 Day, and tMCAO 30 Day groups. B The expression patterns of the genes were analyzed, and 5 model profiles were used to summarize the data. Each box represented an expression model profile. The upper number in the profile box represents the model profile number and the lower number indicates the p value. Two gene expression patterns showed significant p values (p < 0.05) (coloured boxes). Profile NO. 4 and 3 were the significant profiles including 1221 and 1493 genes, respectively. The general trend lines were green. Cluster heatmaps showing upregulation of CD11c-associated genes (C) on the 7–30 Day post-tMCAO. D qPCR for Itgax, Gpnmb, Gpx3, Csf1, Spp1, Igf1. n = 3 per group. **p < 0.01, ***p < 0.001 compared to sham group, values were mean ± SEM. Volcano plots displaying the top 15 genes according to −log10p value on the 7 (E), 14 (F), and 30 Day (G) versus Sham.

