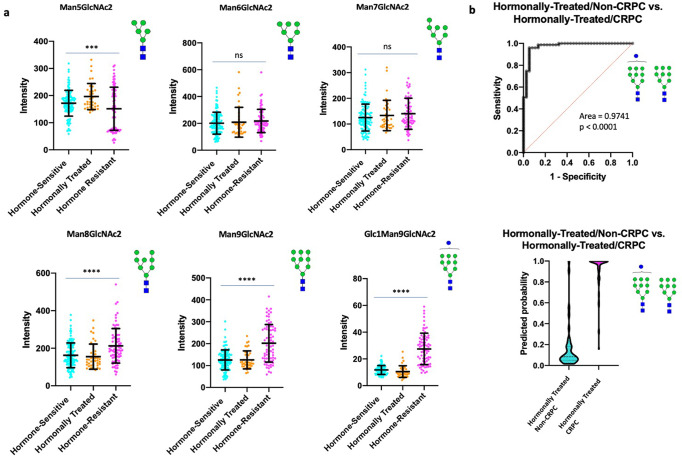
Fig. 6. High mannose structures associated with resistance to hormonal therapy.
a Scatter plot comparisons of Man5–9 abundance in hormone-sensitive (n = 120), hormonally-treated (n = 37), and hormone-resistant (n = 75) tumor regions. One-way ANOVA was used for multiple comparisons with p < 0.05 considered significant. The following system was used to denote significance: p < 0.05 (*), p < 0.01 (**), p < 0.0001 (***), p < 0.00001 (****). Error bars correspond to standard deviation. b (Top) ROC curve demonstrating the predictive power (AUC = 0.9741, p < 0.0001) of Man9 and Glc1Man9 for disease recurrence (Bottom) Violin plot demonstrating the probability of Man9 and Glc1Man9 for predicting disease recurrence (Center line represents median, Upper and lower bars represent 75th and 25th quartiles, respectively).

