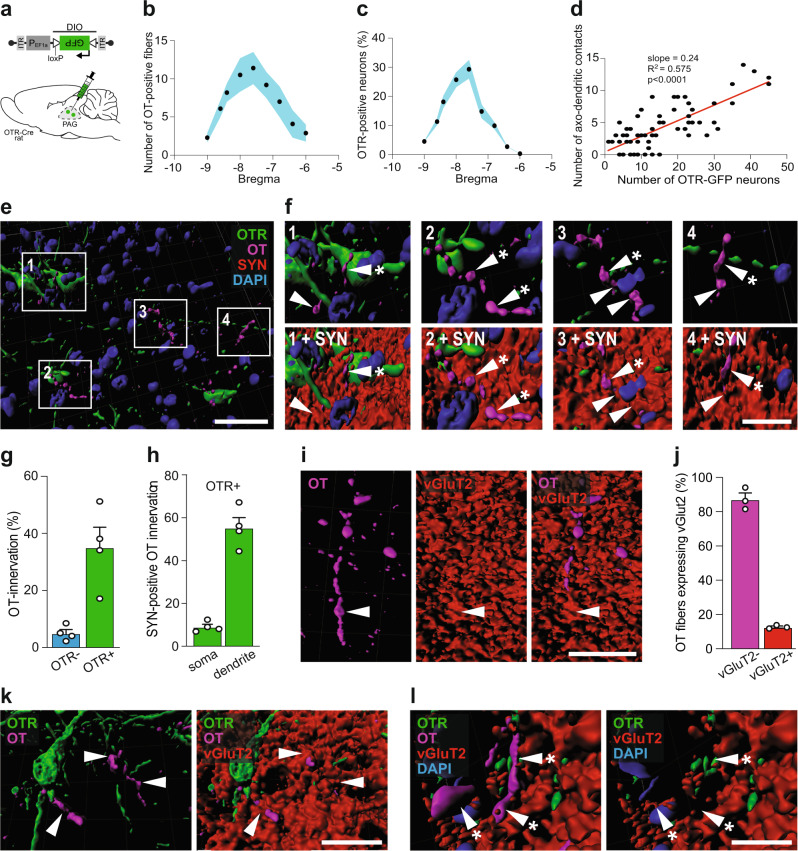
Fig. 3. OT fibers form synaptic and non-synaptic contacts with vlPAG OTR neurons of female rats.
a Schema of rAAV1/2-pEF1α-DIO-GFP injection in the PAG of OTR-Cre rats. b Graph showing the relation between the number of OT fibers in the vlPAG and the bregma level. Blue area represents SEM. nfibers = 290, nrats = 4. c Graph showing the relation between the percentage of OTR neurons in the vlPAG and the bregma level. Blue area represents SEM. ncells = 528, nrats = 4. d Correlation between the numbers of OTR neurons and OT fibers within the same slice (nslice = 64). Each dot represents one analyzed brain section. Pearson r correlation, R2 = 0.5745, p < 0.0001 (two-sided), slope = 0.2438. e, f Three-dimensional reconstruction of OTergic contacts with vlPAG OTR neurons. e Overview image showing OTR-neurons (green), OT-fibers (magenta), synaptophysin (SYN, red), and DAPI (blue). f Magnified images showing contacts with or without SYN. White arrowheads indicate co-localization of OT (magenta) and SYN (red), while white arrowheads with an asterisk show a mismatch of OT and SYN. DAPI = blue, OTR = green. g Bar graph showing the percentage of OTR positive (n = 496) and negative (n = 3840) cells receiving OT innervation (<1 µm distance between fibers and cells). nrats = 4, 8 images per animal, p = 0.0055 (two-sided). h Bar graph showings the percentage of contacts between OT and OTR-positive neurons at somatic and dendritic locations. nrats = 4, 8 images per animal, p < 0.0001 (two-sided). i Reconstruction of a vGluT2-positive (red) OT fibers (magenta) within the vlPAG. j Bar graph showing that the vast majority of OT fibers within the vlPAG are vGluT2-negative (92.4%). n = 4. k, l 3D reconstruction of contacts between an OTR dendrite and OT fibers. k Co-localization of OT (magenta) and vGluT2 (red) are indicated by white arrowheads. l Mismatch of OT (magenta) and vGluT2 (red) are indicated by white arrowheads with an asterisk. DAPI = blue, OTR = green. n = 4 female rats. Scale bars in order of appearance: 50, 10, 10, 20, and 20 µm. Results are expressed as the mean ± SEM and the individual points of each conditions are represented as white circle. Source data are provided as a Source data file.

