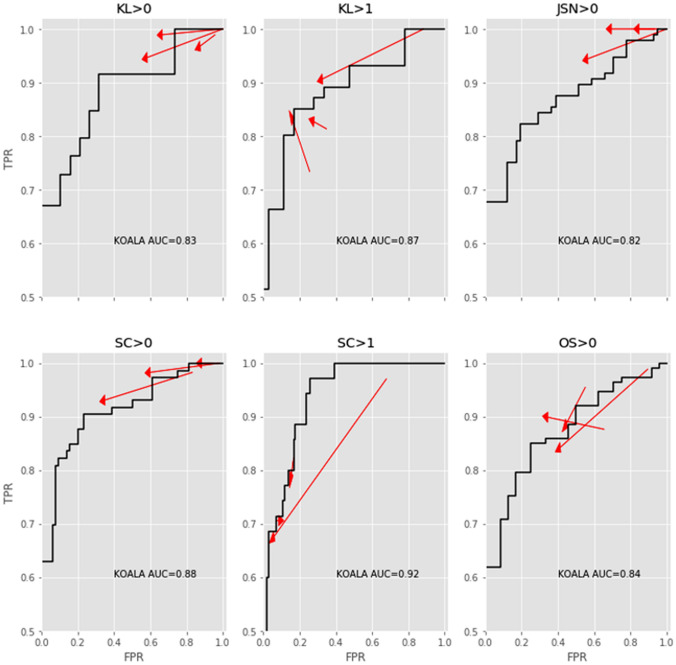
Fig. 4.
Changes to the true positive rate (y-axis, TPR) and false-positive rate (x-axis, FPR) for each individual senior reader for KL > 0, KL > 1, JSN > 0, sclerosis OARSI grade > 0, sclerosis OARSI grade > 1 and osteophyte OARSI grade > 0. The black line denotes the ROC curve for the AI software within the dataset. Arrows point from the unaided to aided modalities. Arrows pointing upward and left indicate absolute improvements in detection ability. Note that even though some arrows point downward and left, the improvement in FPR was greater than the loss in TPR, representing a net increase in accuracy. KL Kellgren–Lawrence, JSN joint space narrowing, SC sclerosis, OS osteophyte

