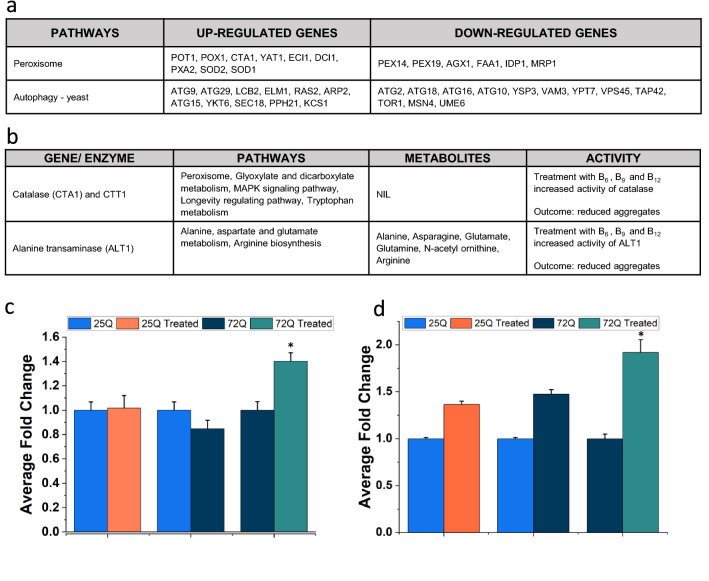
Fig. 5.
Integrated analysis of transcriptomics and metabolomics data (present study). a Representing two key pathways altered in 72Q treated with B6, B12 and folate compared to 72Q, showing upregulated and downregulated genes. b Table summarising Catalase and ALT1 associated pathways and metabolites if any and assay activity. c Results showing significantly increased ALT activity in 72Q treated samples, *p-value < 0.05 and n = 3. d Results showing significantly increased Catalase activity in 72Q treated samples, *p-value < 0.05 and n = 3. The graphs were made in Origin software

