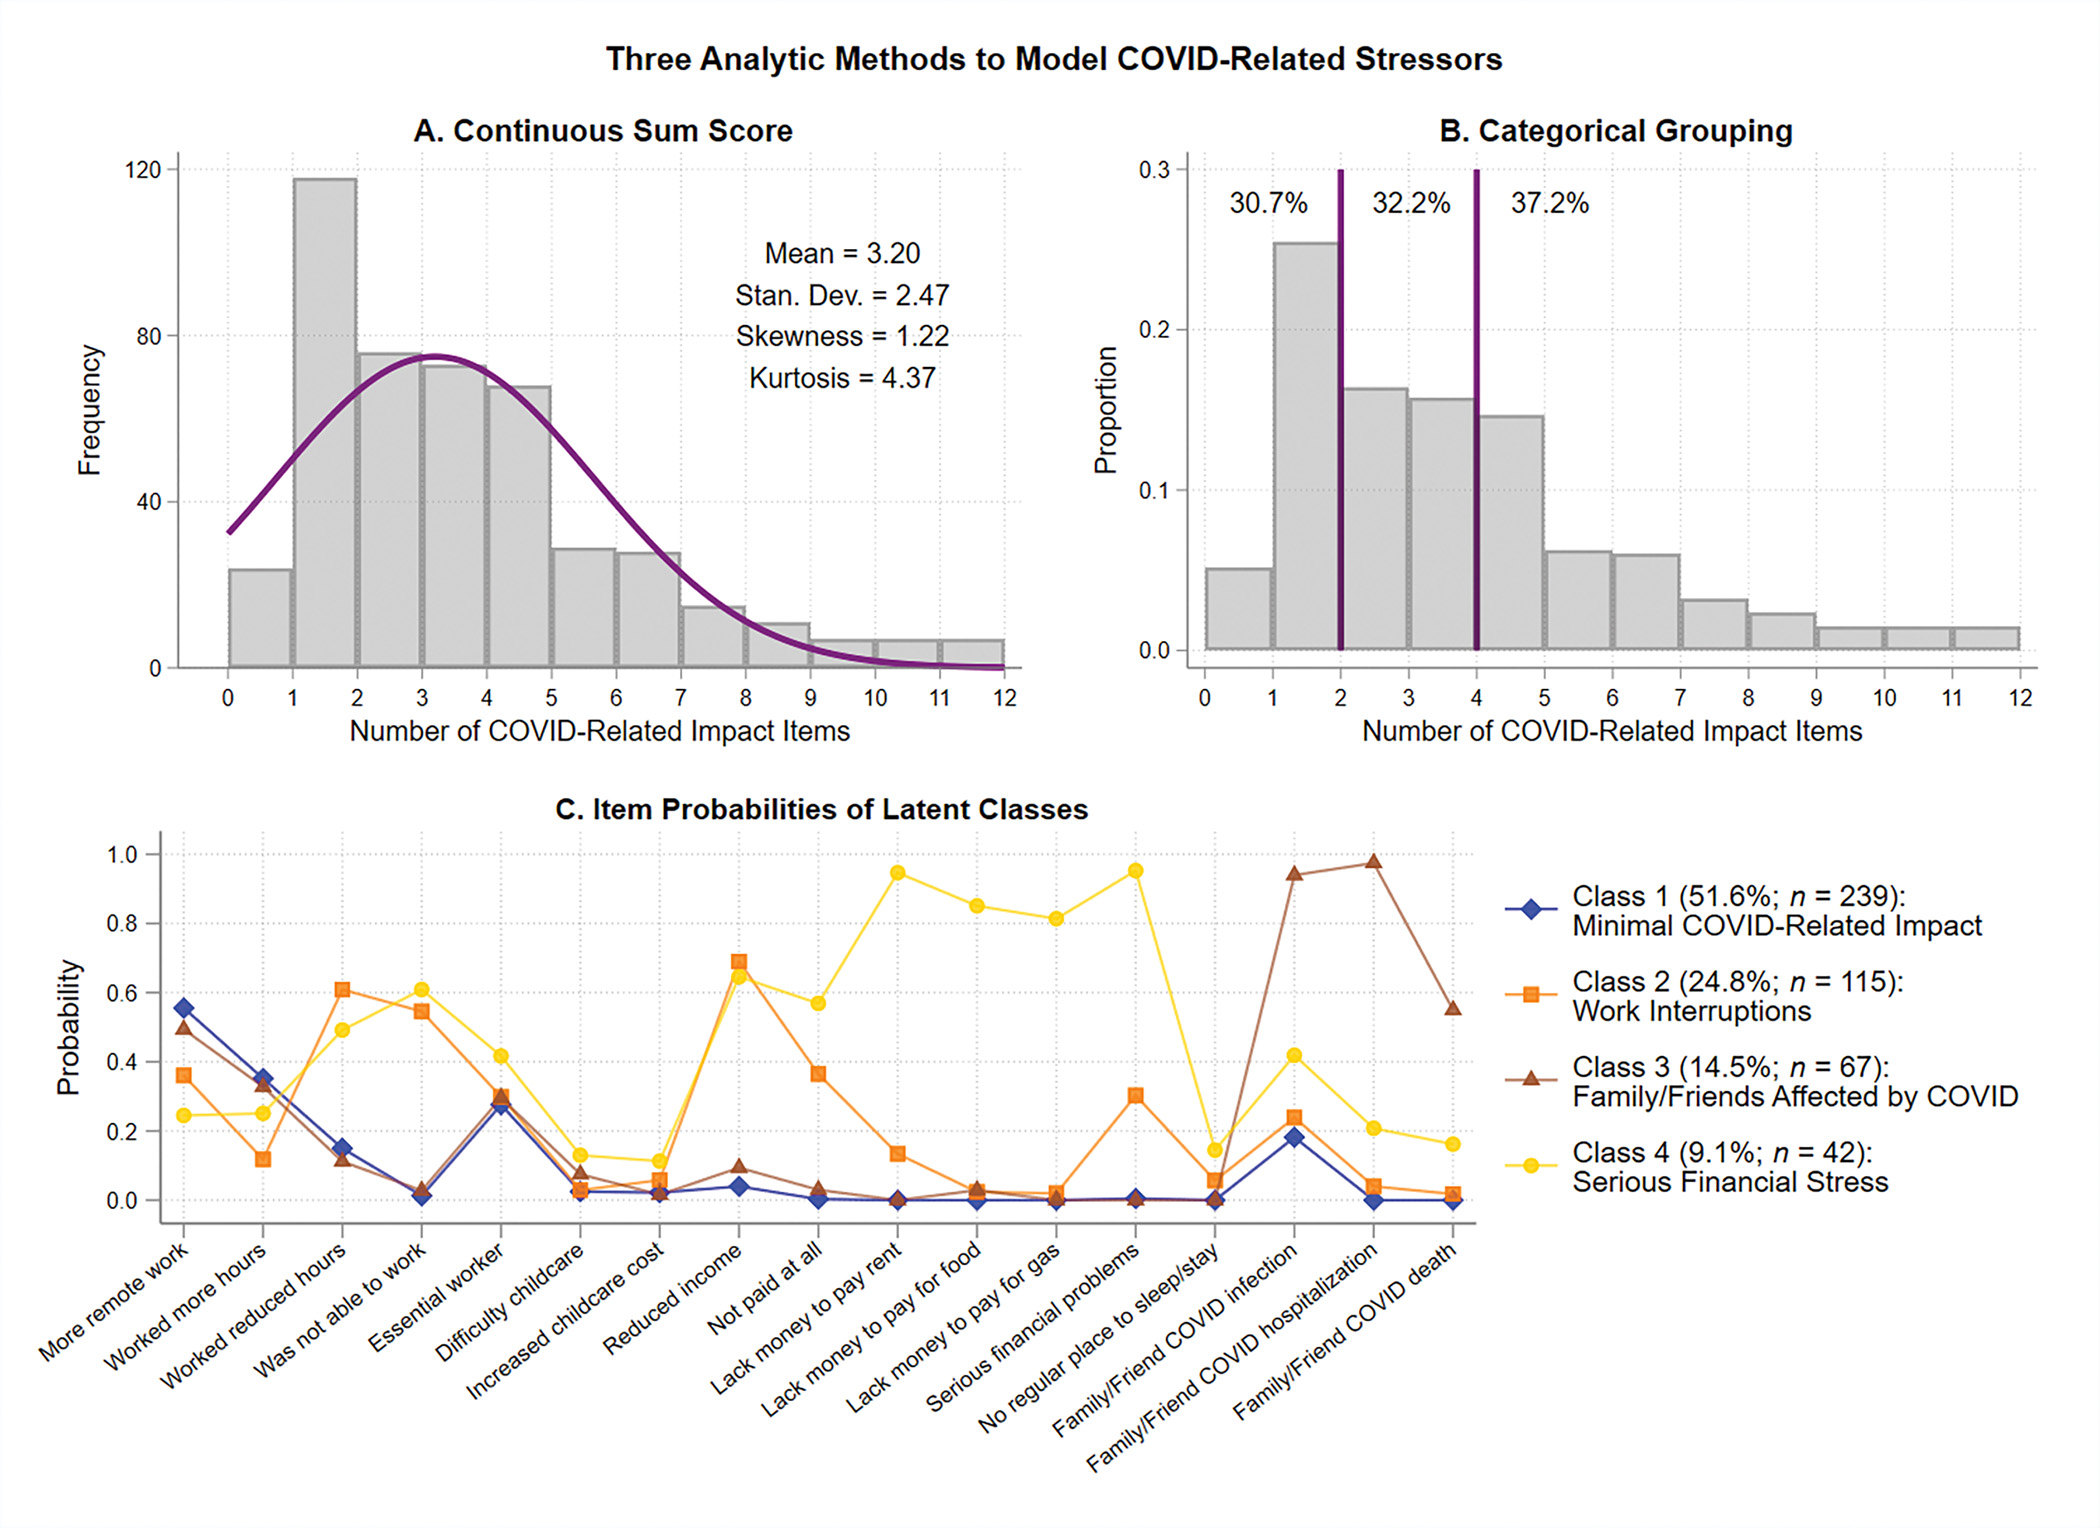
Figure 1.

Continuous Sum Score, Categorical Grouping, and Latent Class Analysis of COVID-Related Stressors
Note. Panel A shows the frequency distribution of COVID-related stressors and the mean, standard deviation, skewness, and kurtosis of the computed continuous sum score. Panel B shows a three-level categorical grouping of COVID-related stressors into low (30.7%), medium (32.2%), and high (37.2%) levels. Panel C shows the optimal four-class solution empirically derived from latent class analysis. See the online article for the color version of this figure.
