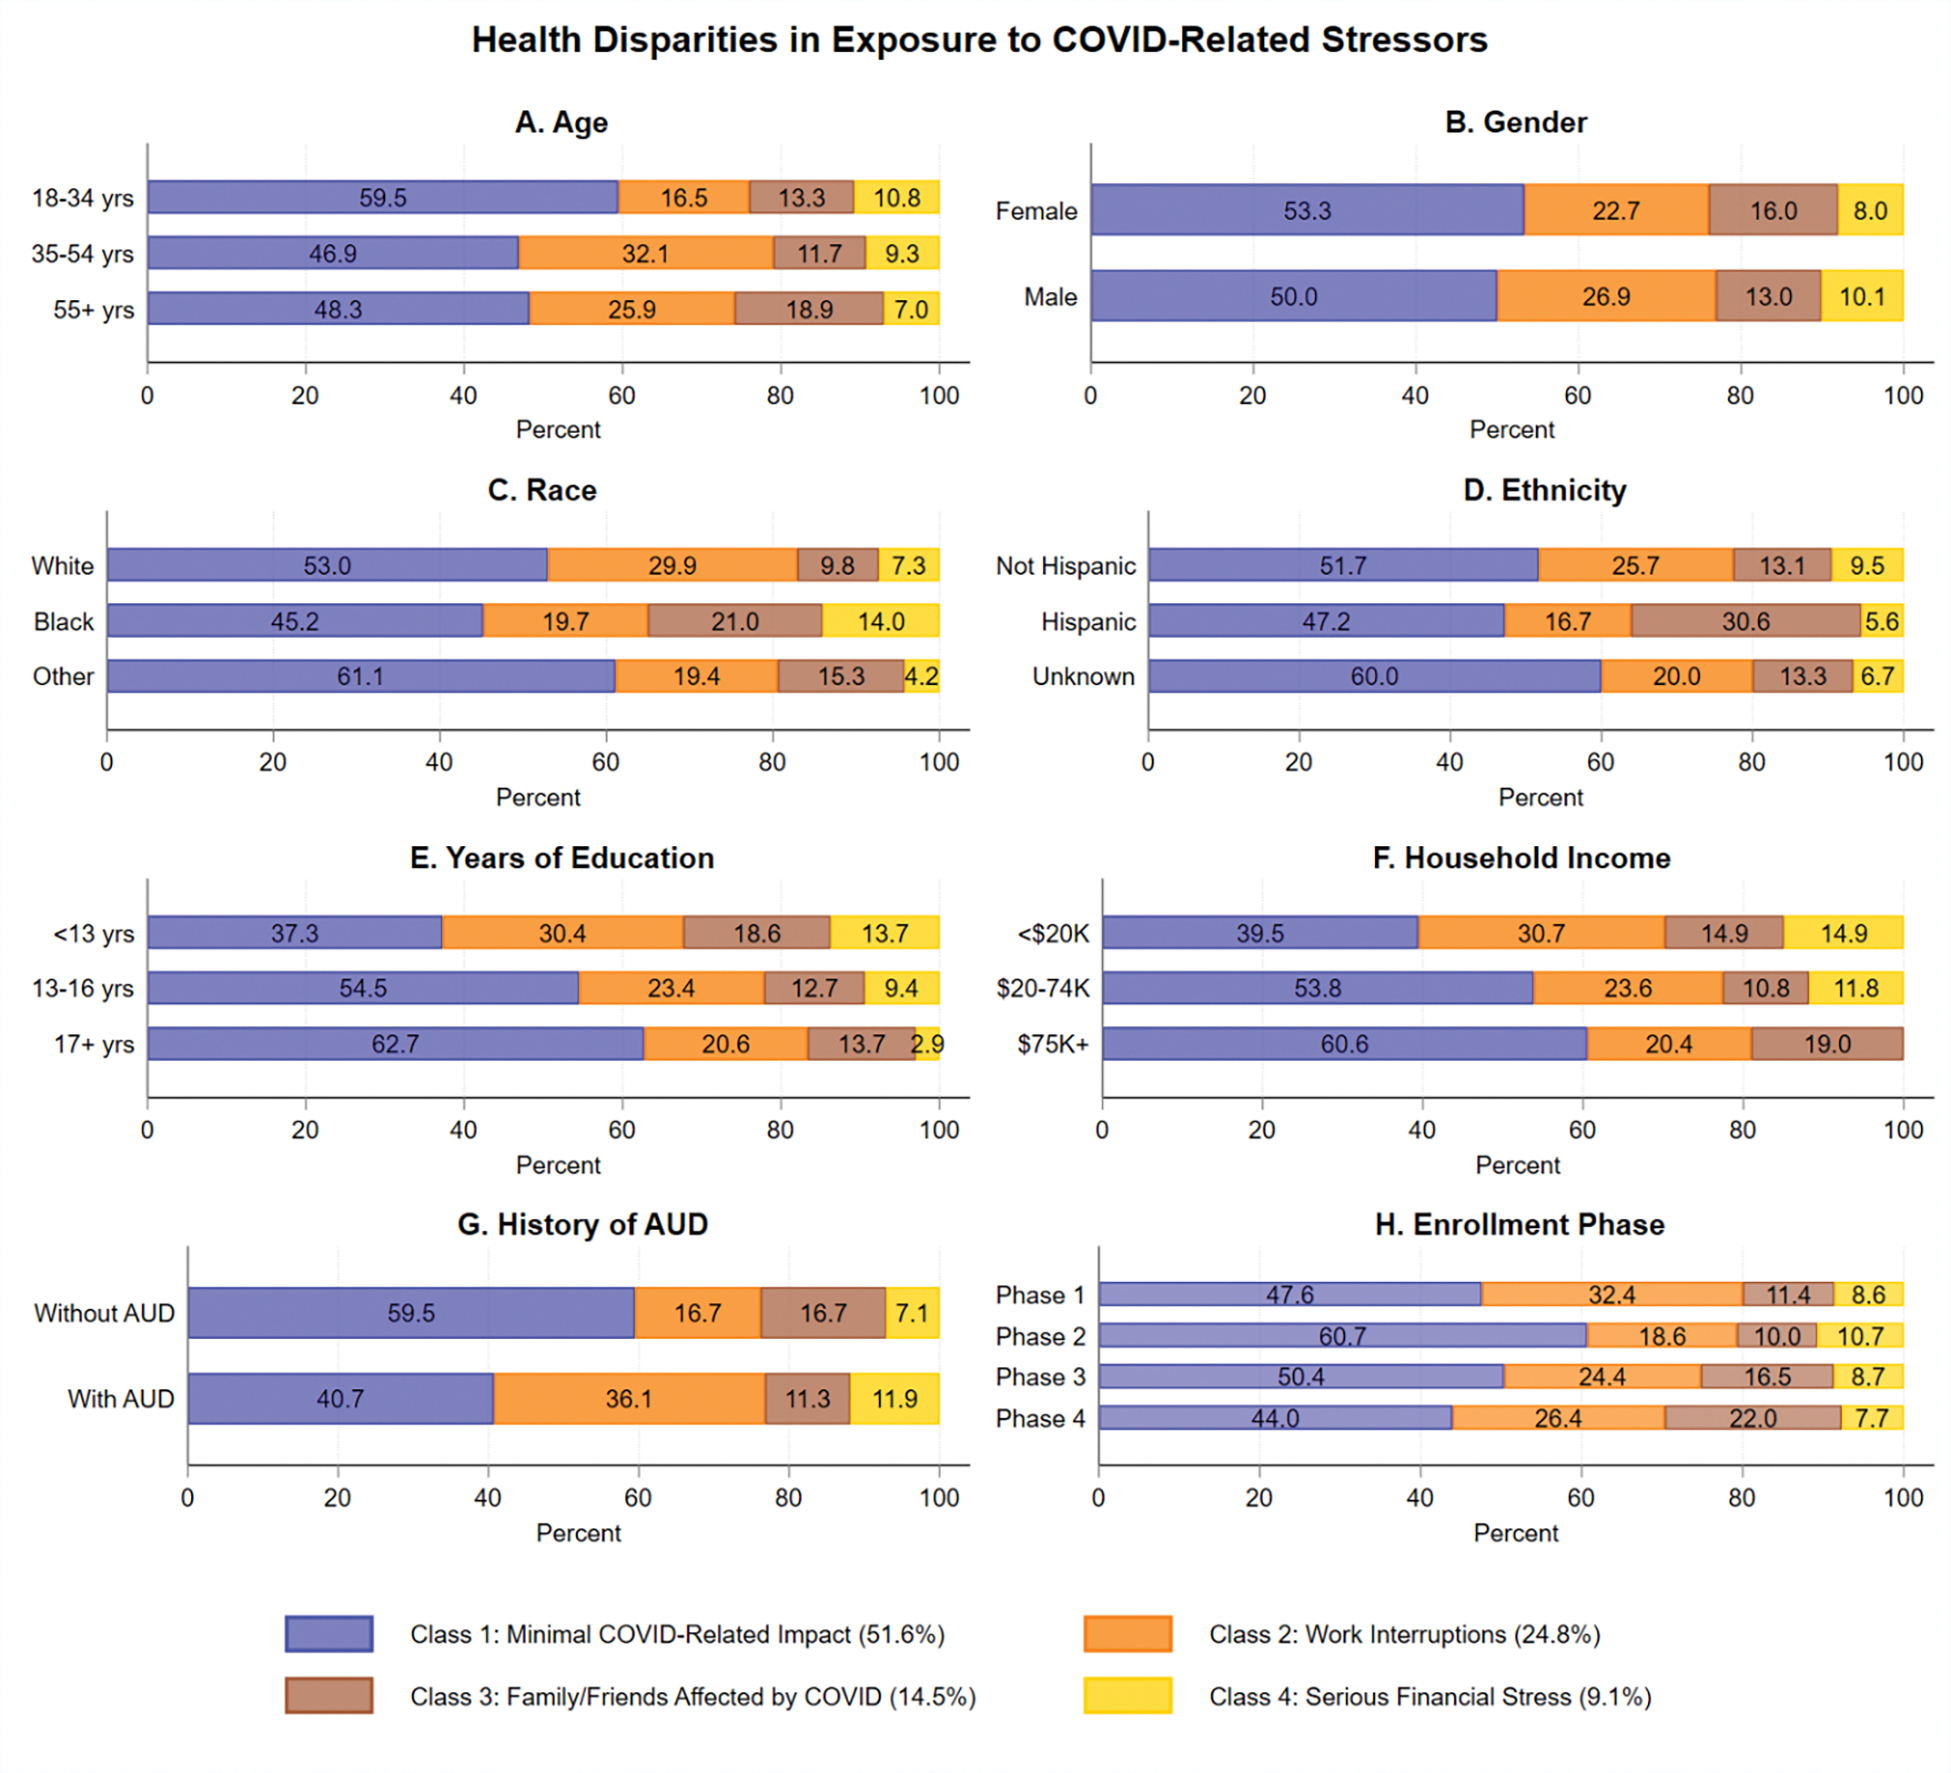
Figure 2.

Proportions of Latent Class Membership by Demographic Characteristics, History of AUD, and Enrollment Phase
Note. This figure shows the proportions of the four latent classes by age (Panel A), gender (Panel B), race (Panel C), ethnicity (Panel D), years of education (Panel E), household income (Panel F), history of AUD (Panel G), and enrollment phase (Panel H). AUD = alcohol use disorder. See the online article for the color version of this figure.
