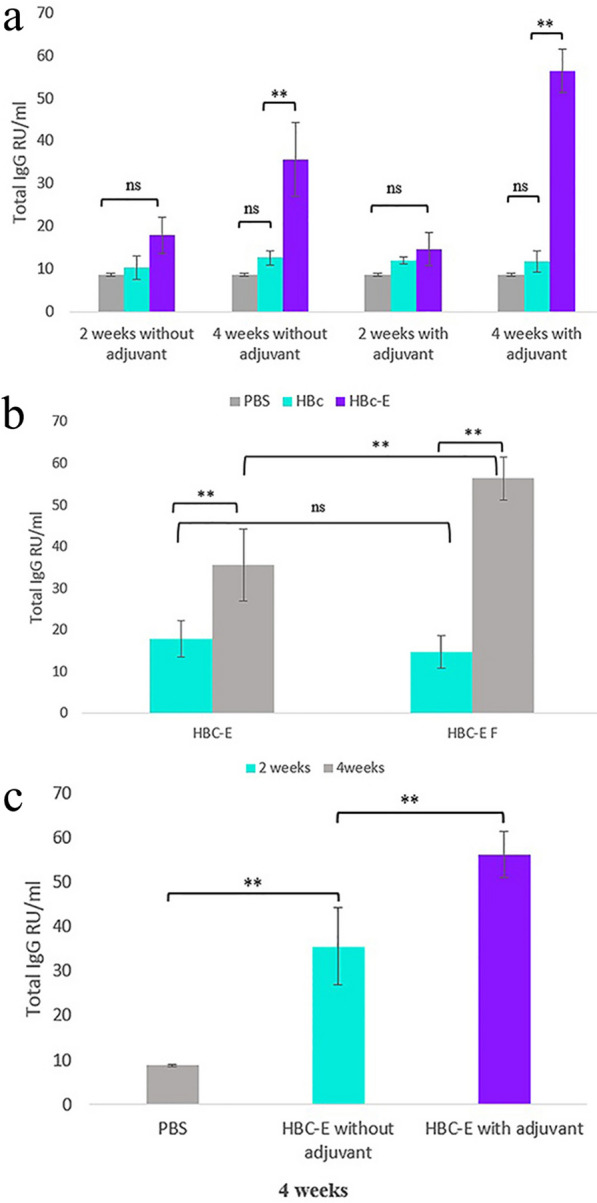
Fig. 3.

a Immunization analysis of mice injected with HBc VLP-E vaccine, HBc VLP, and PBS controls. The total specific SARS-CoV-2 spike IgG production presented in RU/ml two and 4 weeks after the second dose injection. Each measure is presented as the mean ± SD value of three mice with two replicates and analyzed by Duncan's test (p < 0.01). b Comparison of the specific IgG production between the two intervals after the HBc-VLP E immunization in both conditions with and without adjuvant. Each measure is presented as the mean ± SD value of three mice analyzed by Duncan’s test (p < 0.01). c Comparison of the specific IgG production with and without adjuvant utilization after four weeks of HBc-VLP E injection. Each measure is presented as the mean ± SD value of three mice with two replicates and analyzed by Duncan's test (p < 0.01)
