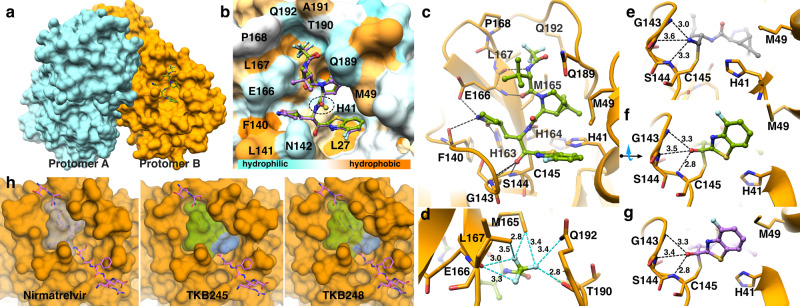
Fig. 4. Co-crystal structures of TKB245 and TKB248 with SARS-CoV-2 Mpro.
a Overview of Mpro dimer in complex with TKB245. Molecular surface of protomer A colored in cyan and protomer B in orange. b Superimposition of TKB245 in green onto TKB248 in purple exhibits identical binding mode. Mpro binding pocket is colored according to hydrophobicity scale. Hydrophobicity of the binding pocket is represented by the intensities of orange color such as hydrophobic residues: Leu-27 and Phe-140 as shown in orange. Polar or charged residues such as Glu-166, Gln-189 are shown in light blue. c Binding mode and hydrogen bond network in Mpro complexed with TKB245. Cartoon representation of the crystal structure of Mpro is shown in orange complexed with TKB245 (green stick). Hydrogen bonds are indicated as black dashed lines. d Top view focused on trifluoromethyl (P4) group with potential fluorine-based interaction: Less than 4 Å are indicated as cyan dashed lines. Three fluorine atoms engaged in multi-directional halogen bond interactions with surrounding residues consist of Leu-167, Pro-168, Gln-192, and Met-165. e–g Comparison of nirmatrelvir (PBD ID: 7RFW) vs TKB245 (PBD ID: 8DOX) and TKB248 (PBD ID: 8DPR) inside the S1’ subsite including oxyanion hole interactions. While all inhibitors covalently bind to the catalytic residue Cys-145, the 4-fluorobenzothiazole ring with the fluorine atom points to solvent. h Side-by-side comparison of nirmatrelvir vs TKB-245 and TKB-248 (as shown in transparent surface) onto the polyprotein substrate. Blue color indicates the 4-fluorobenzothiazole ring of TKB245 and TKB248 that effectively fill the S1’subsite compared to nirmatrelvir.

