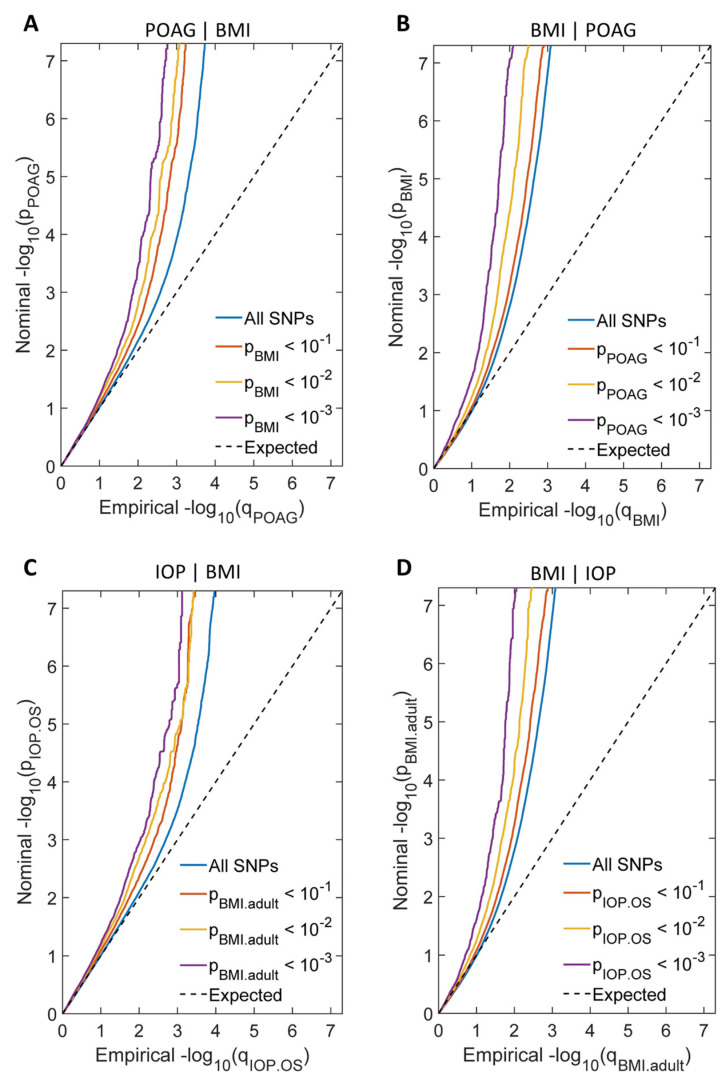
Figure 3.
Conditional Q-Q plots showed cross-trait enrichment between POAG/IOP and BMI. (A) Conditional Q-Q plot of nominal—log10(p) for SNPs association with POAG as a function of statistical significance for SNPs association with BMI at the predefined stratum of p values. The lines with sharp leftward deviated tails showed the true associations between POAG and BMI. (B) Conditional Q-Q plot of nominal—log10(p) for SNPs association with BMI as a function of statistical significance for SNPs association with POAG at the predefined stratum of p values. The lines with sharp leftward deviated tails showed the true associations between BMI and POAG. (C) Conditional Q-Q plot of nominal—log10(p) for SNPs association with IOP as a function of statistical significance for SNPs association with BMI at the predefined stratum of p values. The lines with sharp leftward deviated tails showed the true associations between IOP and BMI. (D) Conditional Q-Q plot of nominal—log10(p) for SNPs association with BMI as a function of statistical significance for SNPs association with IOP at the predefined stratum of p values. The lines with sharp leftward deviated tails showed the true associations between BMI and IOP.

