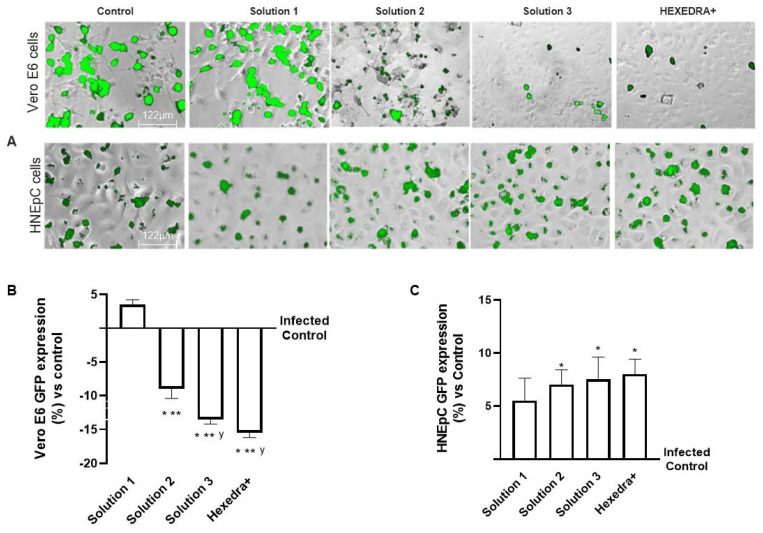
Figure 4.
Analysis of infection of Vero E6 and HNEpC cells with VSV-based pseudovirus SARS-CoV-2 (MOI 0.1) pre-treated with the different UA-based formulations. The images reported were an example of each stimulation for GFP fluorescence expression obtained at 40× magnification by Paula (Leica DM1000). The positive cells were counted analyzing GFP expression in cells by the Image J software and the results were expressed as mean ± SD (%) compared to infected control cells (0 line) of four independent experiments. The abbreviations are the same reported in Figure 2. * p < 0.05 vs. infected control; ** p < 0.05 vs. Solution 1; y p < 0.05 vs. Solution 2.

