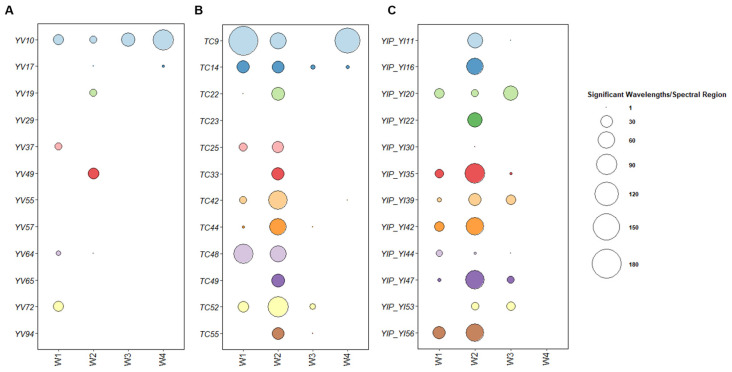
Figure 4.
Number of significant different wavelengths detected in the comparison between each S. cerevisiae parental strain and the selected 12 MSCs. Spectra were compared using the Student’s t-test for each wavelength separately. The number of wavelengths with statistically significant difference (p < 0.01) was calculated for each specific spectral area separately, namely: fatty acids (W1), amides (W2), mixed region (W3) and carbohydrates (W4) regions. (A–C): MSCs of YVGC13A, TC1517 and YI30, respectively.

