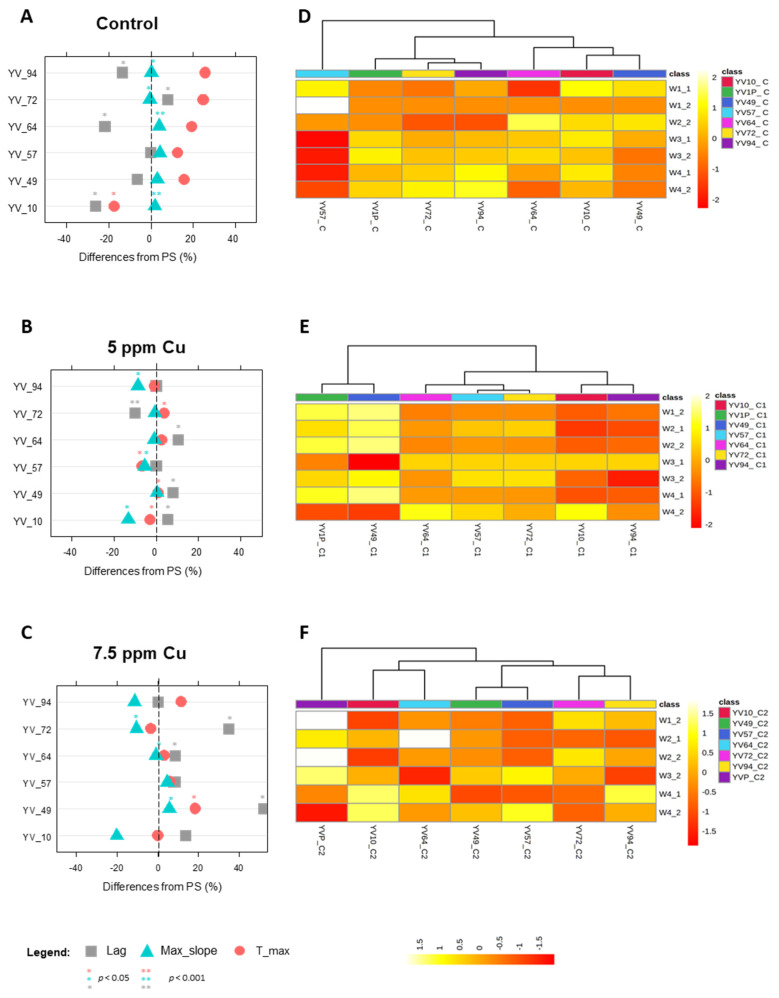
Figure 5.
Growth and metabolomic phenotypes of YVGC13A S. cerevisiae parental strain and its derived MSCs during growth at increasing concentrations of copper (5–7.5 ppm). Panels (A–C): Lag time (grey square), max_slope (light blue triangle) and t_max (light red circle) parameters reported as percentage difference respect to the parental strain. Panels (D–F): Heatmap of the significantly altered FTIR peaks (distance measure using Euclidean, and clustering algorithm using ward.D). The coloured boxes indicate the relative intensities of the mean of peaks in the corresponding spectral region. The colour scale is log2 transformed value and indicates relatively high (yellow) and low (red) peak intensities. Spectral regions have been divided into sub-regions, namely: Fatty acids (W1_1 from 3200 to 3100 cm−1–W1_2 from 3098 to 2801 cm−1); Amides (W2_1 from 1800 to1649 cm−1–W2_2 from 1647 to 1501 cm−1); Mixed region (W3_1 from 1499 to 1352 cm−1–W3_2 from 1350 to 1202 cm−1); Carbohydrates (W4_1 from 1200 to 1053 cm−1–W4_2 from 1051 to 902 cm−1).

