Figure 1.
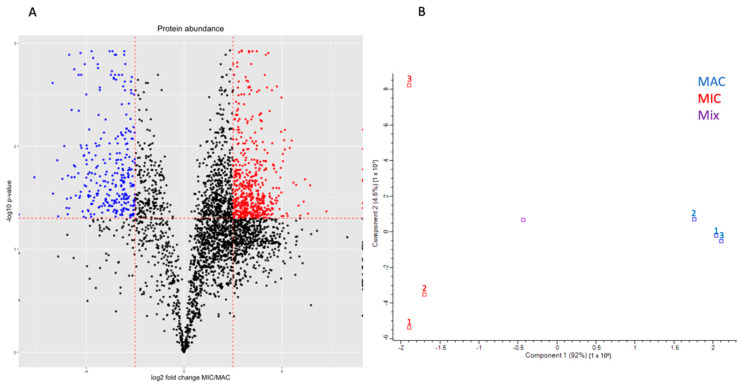
Proteomic analysis of TMT-labeled Oxytricha nuclear samples. (A) Volcano plot generated with ggplot2 [29] of identified protein groups from mass spectrometry data. Proteins predicted to localize to mitochondria using DeepLoc2 were removed. The log2 ratio of average MIC sample reporter ion intensity over average MIC sample reporter ion intensity was plotted against the inverse log10 of the FDR-adjusted p-value of the difference between nuclei. Proteins significantly enriched in either the MAC or MIC (log2 ratio < −2 or > 2 and adjusted p-value < 0.05) were plotted in blue and red points respectively. (B) PCA analysis generated with Perseus [30] of the intensities from the 3 MAC and MIC replicates are plotted in blue and red, respectively, as well as the control mix of all 6 samples plotted in purple. The MAC and MIC samples are well separated along PC1, which accounts for most of the variability between nuclear samples. While the MIC replicates do not cluster together as tightly as the MAC replicates on PC2, this component represents far less of the variance among the samples compared to PC1.

